Company work · Desktop application
Drug Interaction Reporter
An internal tool I built at Built by Doctors that turns a list of drugs into a complete PowerPoint interaction report. It searches three clinical sources and uses a model I fine-tuned, reducing report production from about two weeks to as little as two days.
- Report production
- ~2 weeks → ~2 days
- As little as two days; most remaining time is human review.
- Typical report
- ~80 drugs
- 3,160 pairs and almost 9,500 source lookups.
- One workflow
- 3 sources
- DrugBank, Drugs.com, and Epocrates.
- My role
- Full-stack development, architecture, database design, automation, AI dataset preparation and fine-tuning, CI/CD, and releases.
- Built with
- Electron · Angular · TypeScript · Node.js · PostgreSQL · OpenAI fine-tuning · Playwright · Web scraping · PPTX generation · Nx · Tailwind CSS · GitHub Actions
- Company
- Built by Doctors (BBD)
- Timeline
- Approximately 6 months
- Status
- In production use, with auto-updating releases
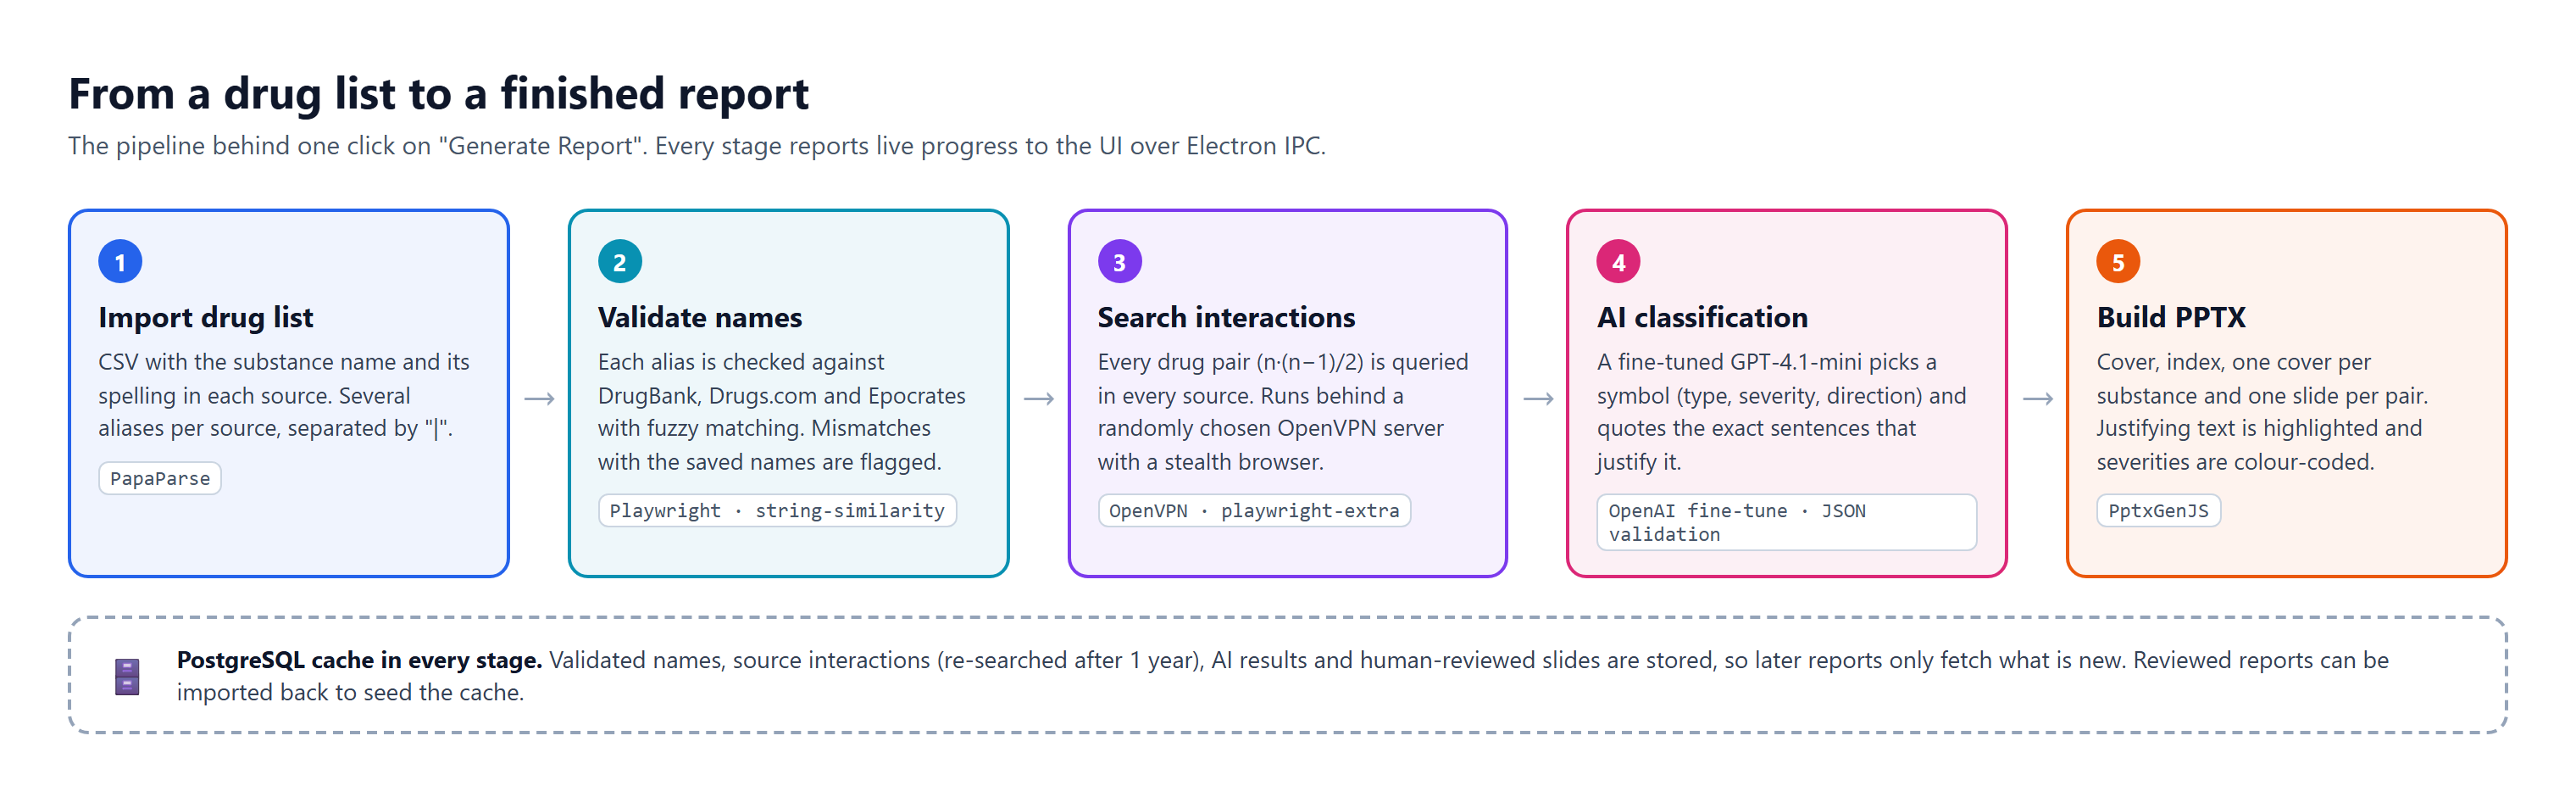
Overview
Drug Interaction Reporter is a desktop app built with Electron and Angular for Built by Doctors. A user uploads a CSV of substances; the app validates their names across DrugBank, Drugs.com, and Epocrates, searches the drug pairs, proposes interaction symbols using a fine-tuned GPT-4.1-mini model, and generates a PowerPoint deck with supporting evidence highlighted for review. PostgreSQL stores the fetched data, AI results, and human-reviewed decisions so later reports can reuse that work.
The problem
The team’s older internal program could run a search and create blank report pages, but most work was still manual. Someone had to look up each pair on three websites, copy descriptions, choose a symbol, and lay out the slides. A typical list of about 80 drugs creates 3,160 pairs and nearly 9,500 source lookups. One report could take up to two weeks.
The solution
I rebuilt the application from scratch, keeping the original idea and redesigning the pipeline around stored results, source-specific search strategies, AI-assisted classification, and finished PPTX generation. I also built partial reports, reviewed-deck imports, a database browser, settings, and automatic releases. The screenshots below use demo drug names, counts, and descriptions; they contain no company or client data.
Walkthrough
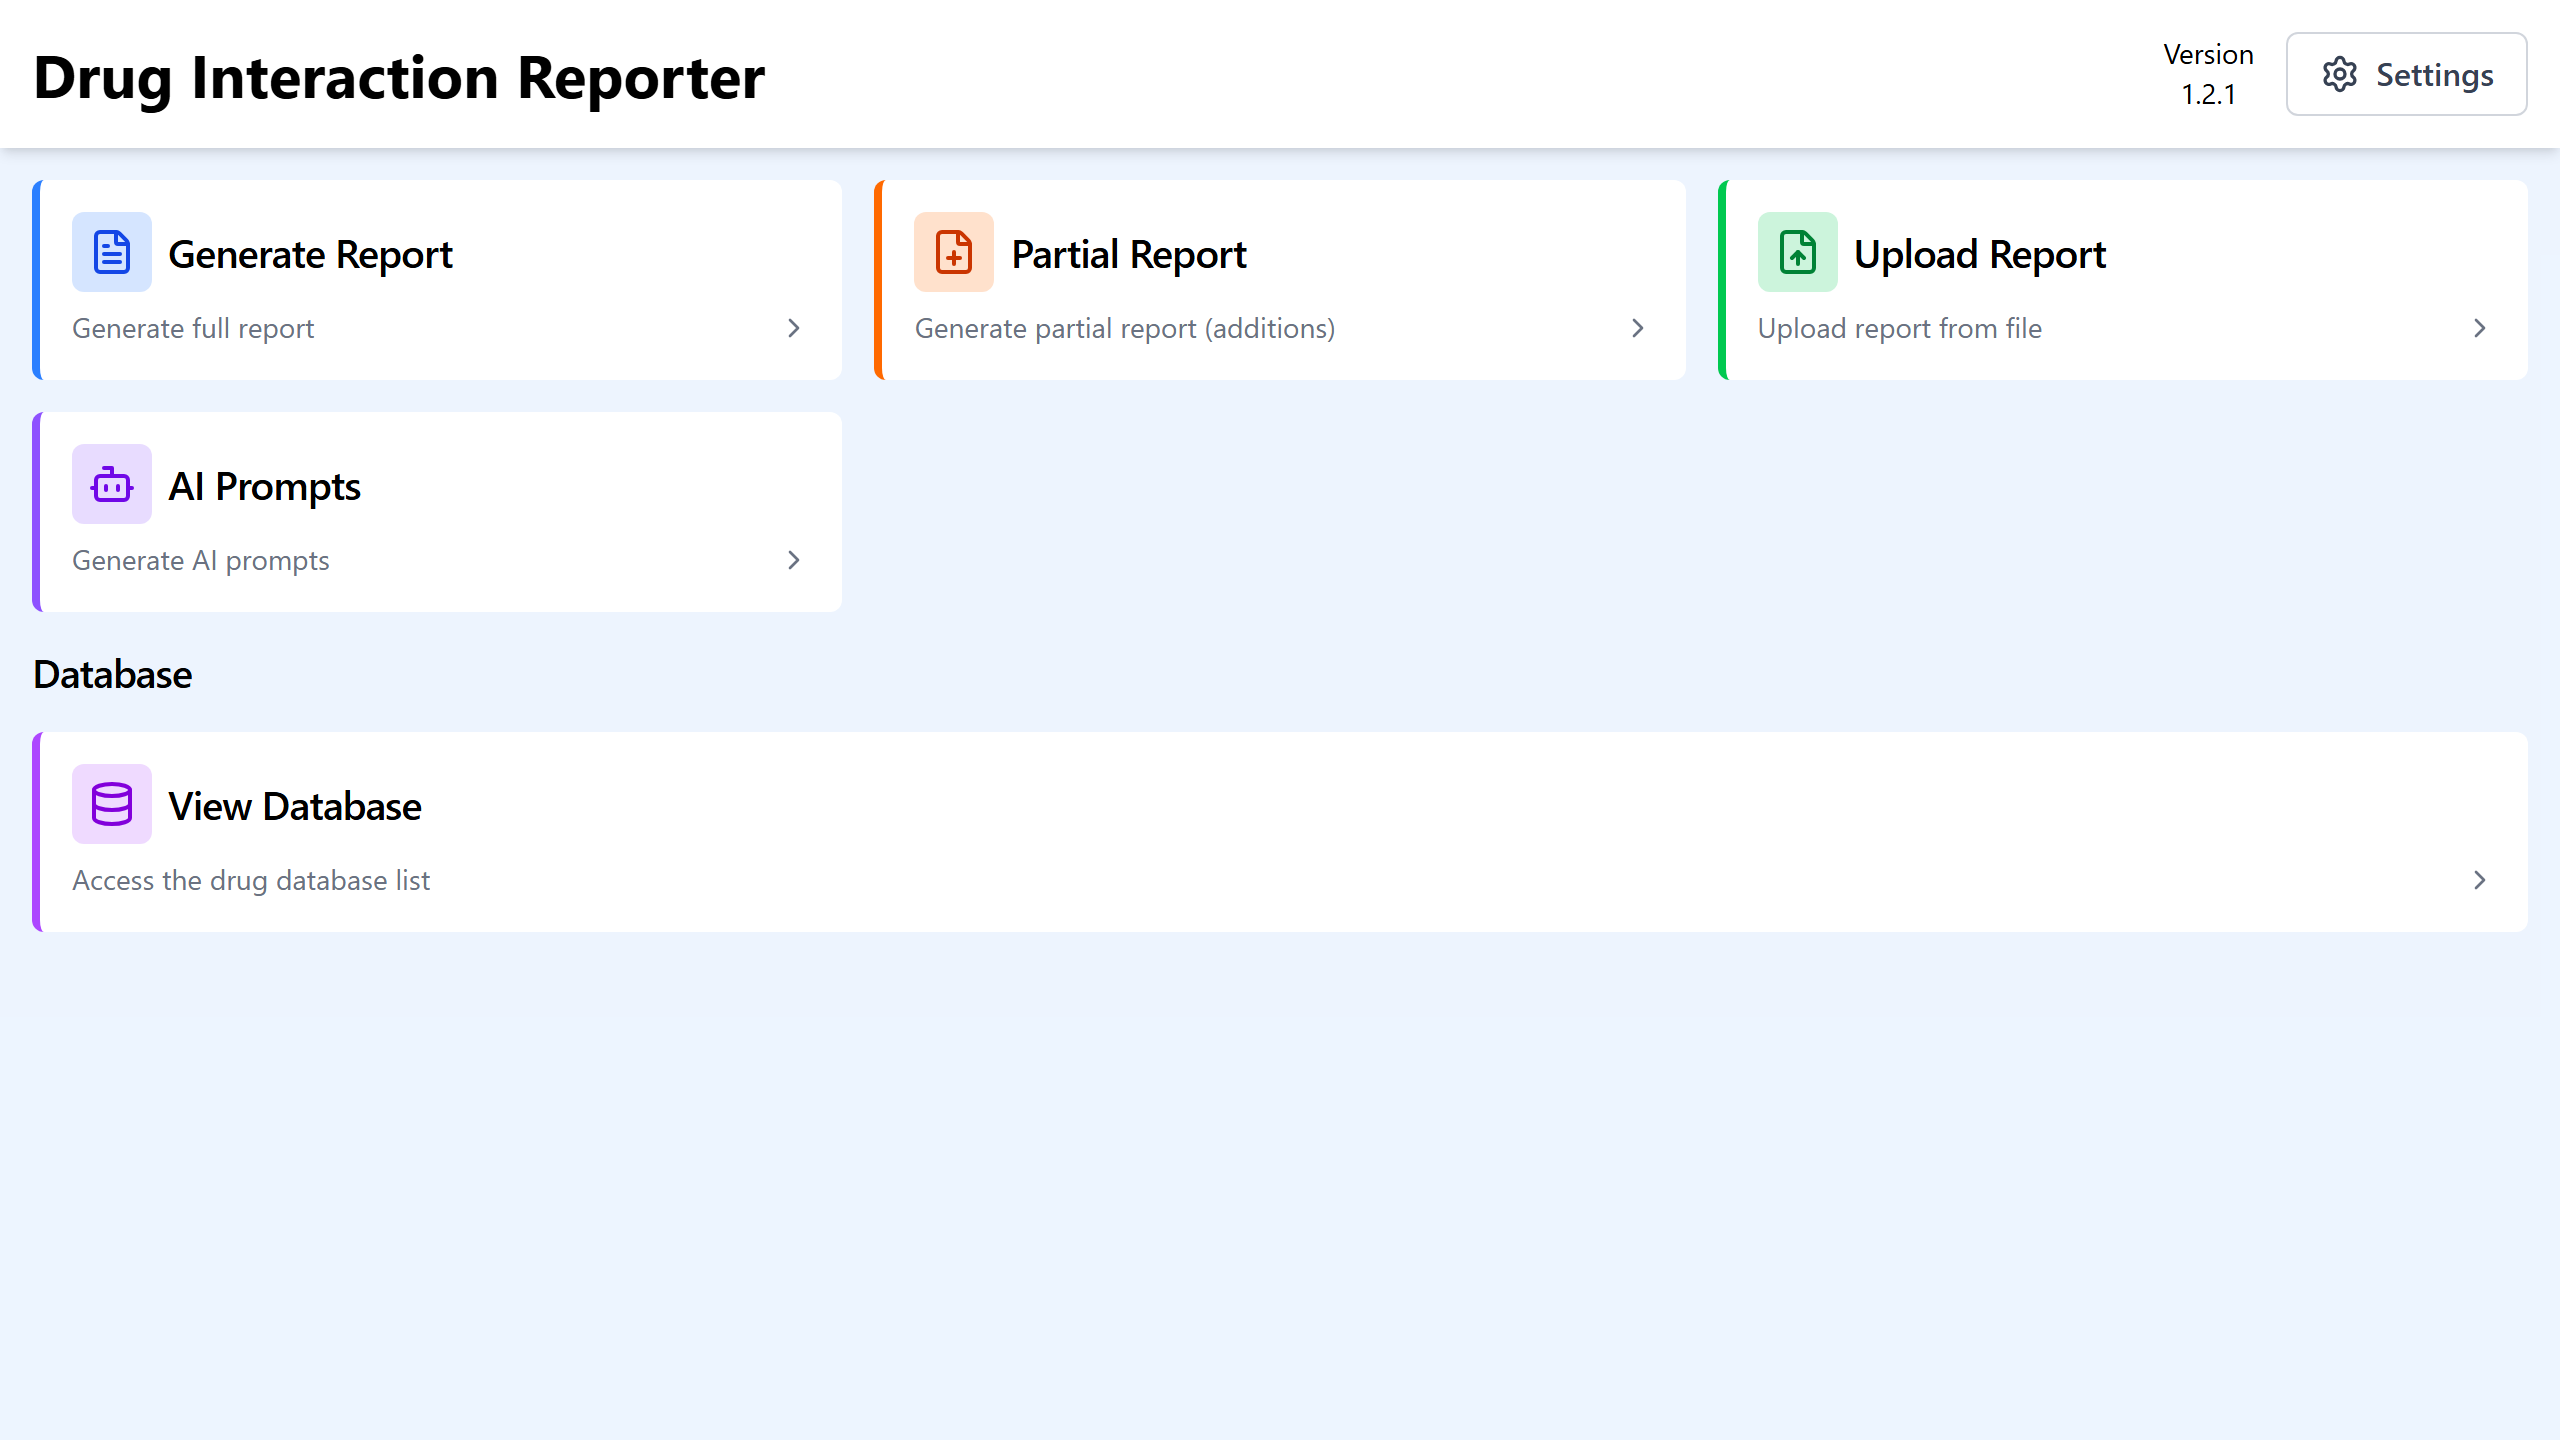
1. Choose a workflow
The home screen brings together full reports, partial reports, reviewed-report imports, AI prompt exports, and the database browser.
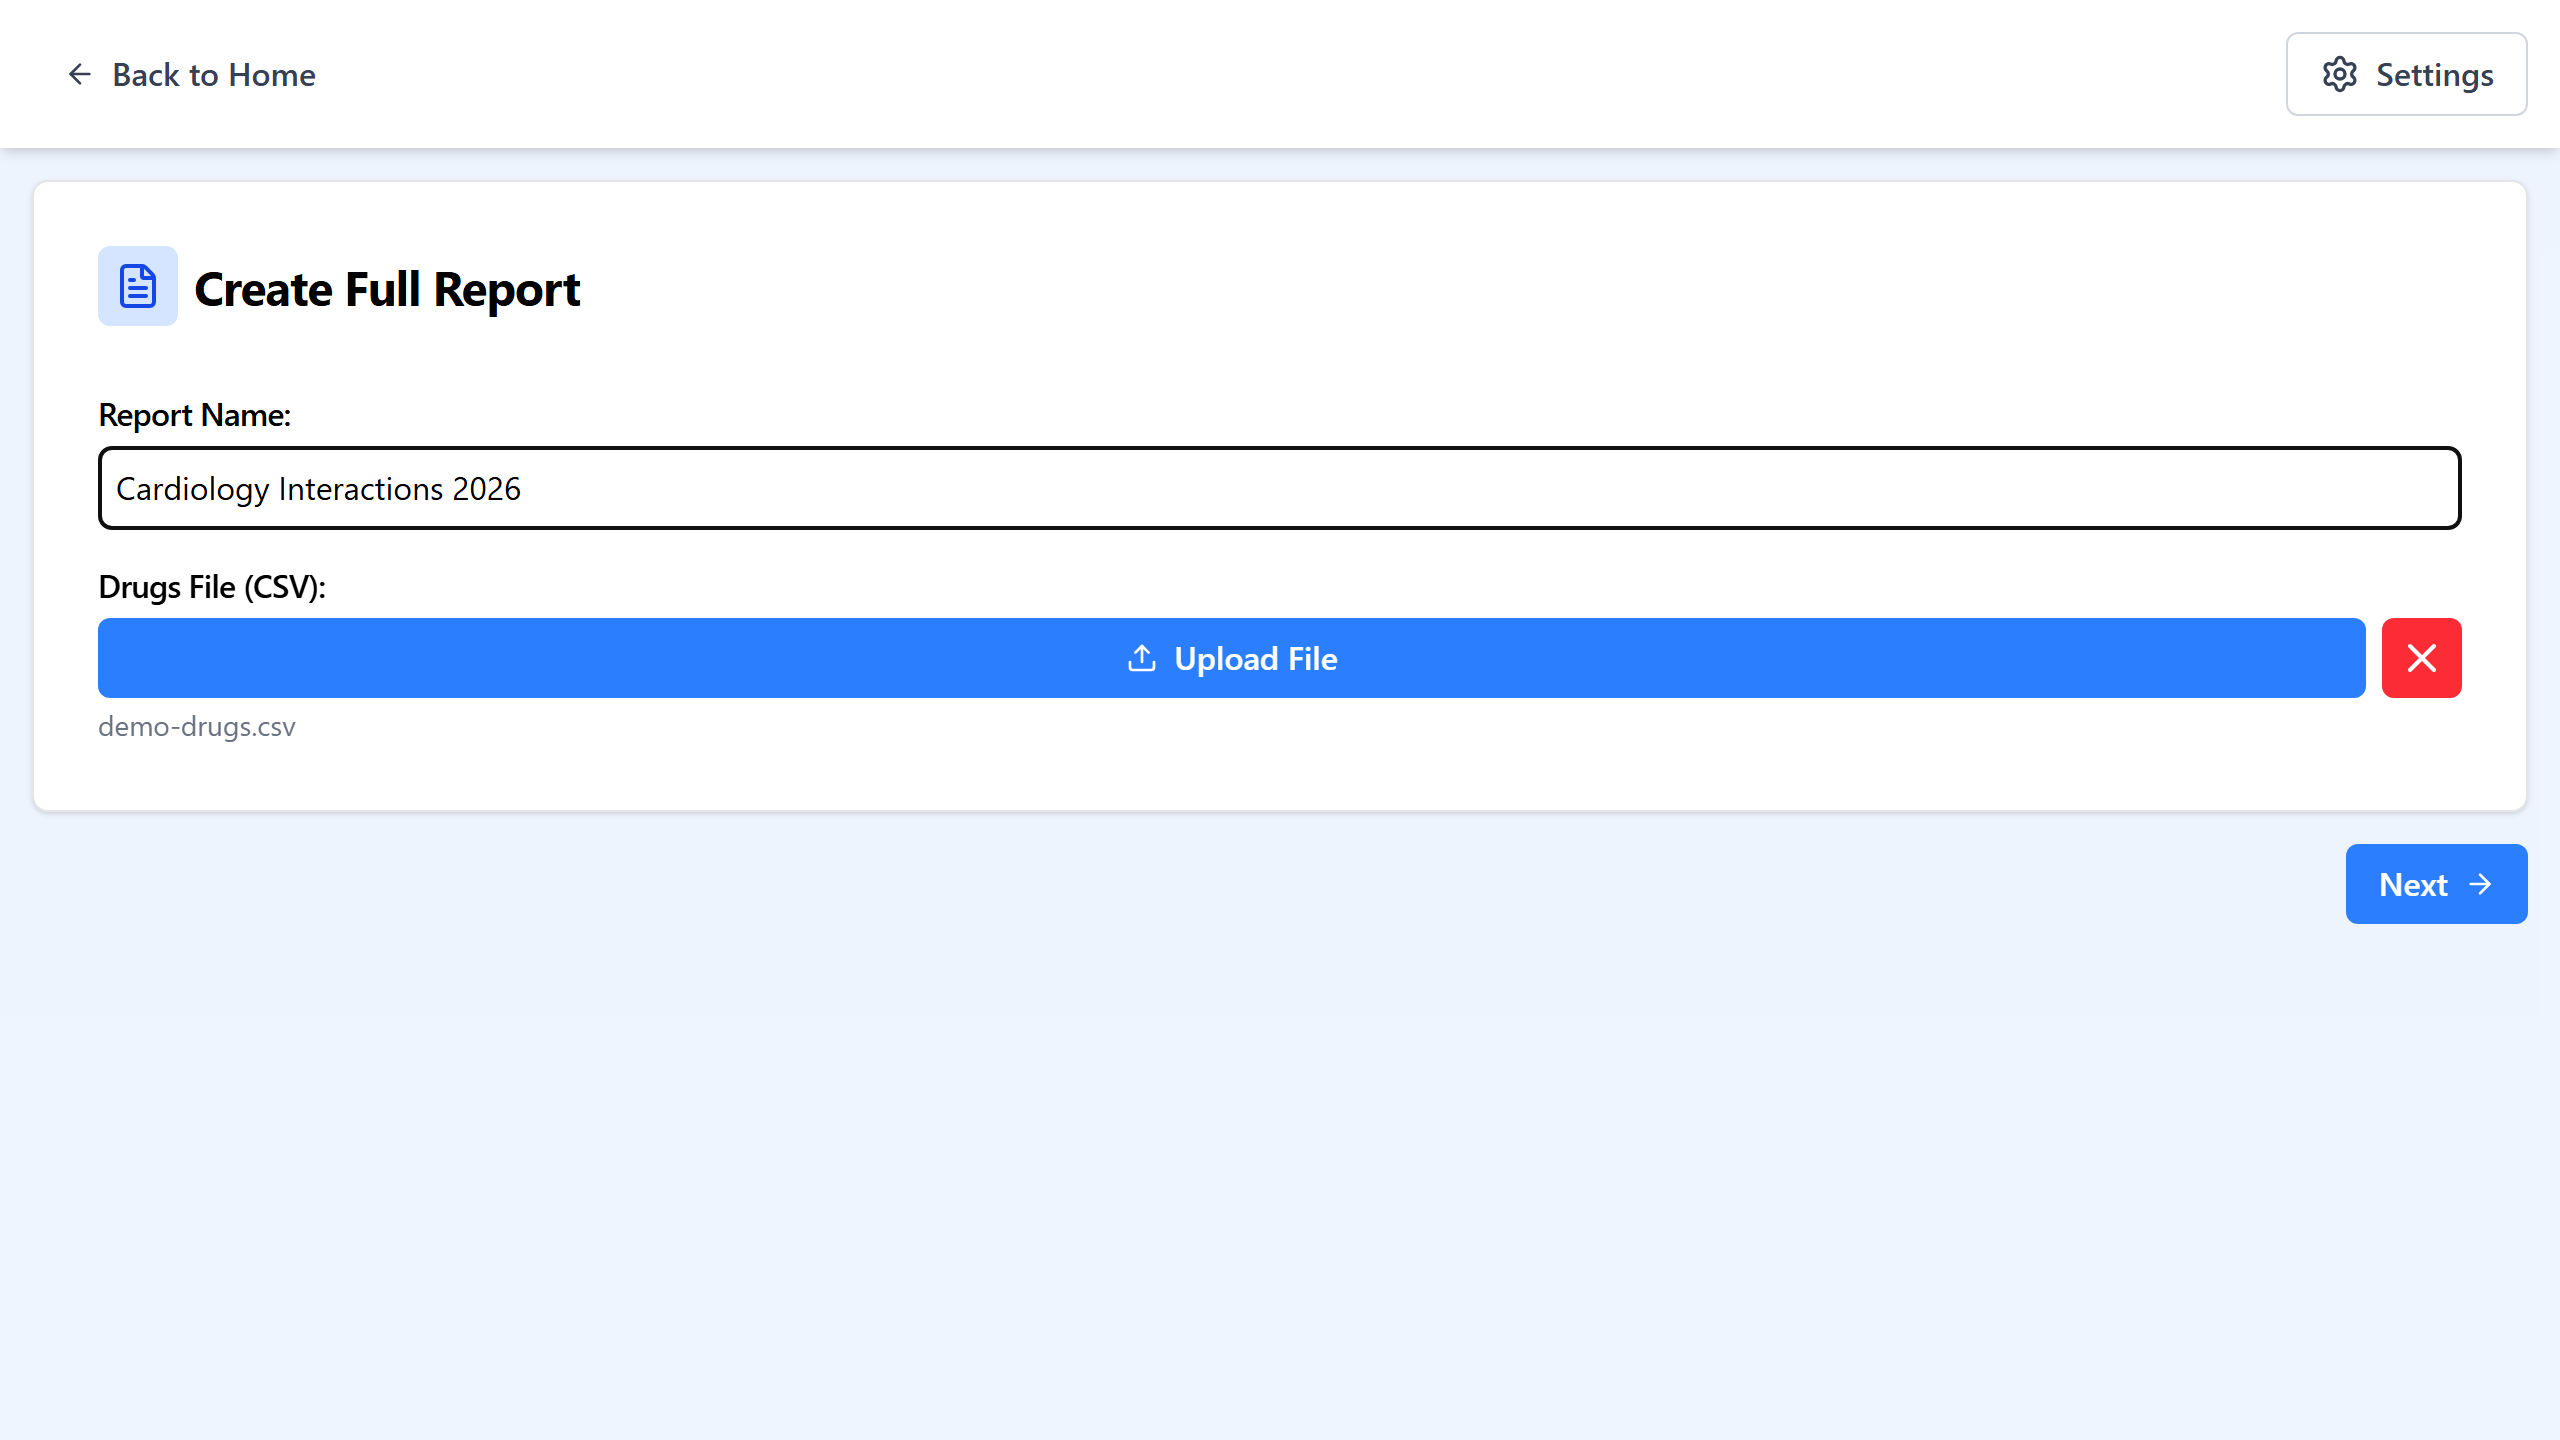
2. Create a report
Name the report and upload a CSV containing the substance name and its spelling in each source. Multiple aliases can be supplied for each source, separated by a vertical bar.
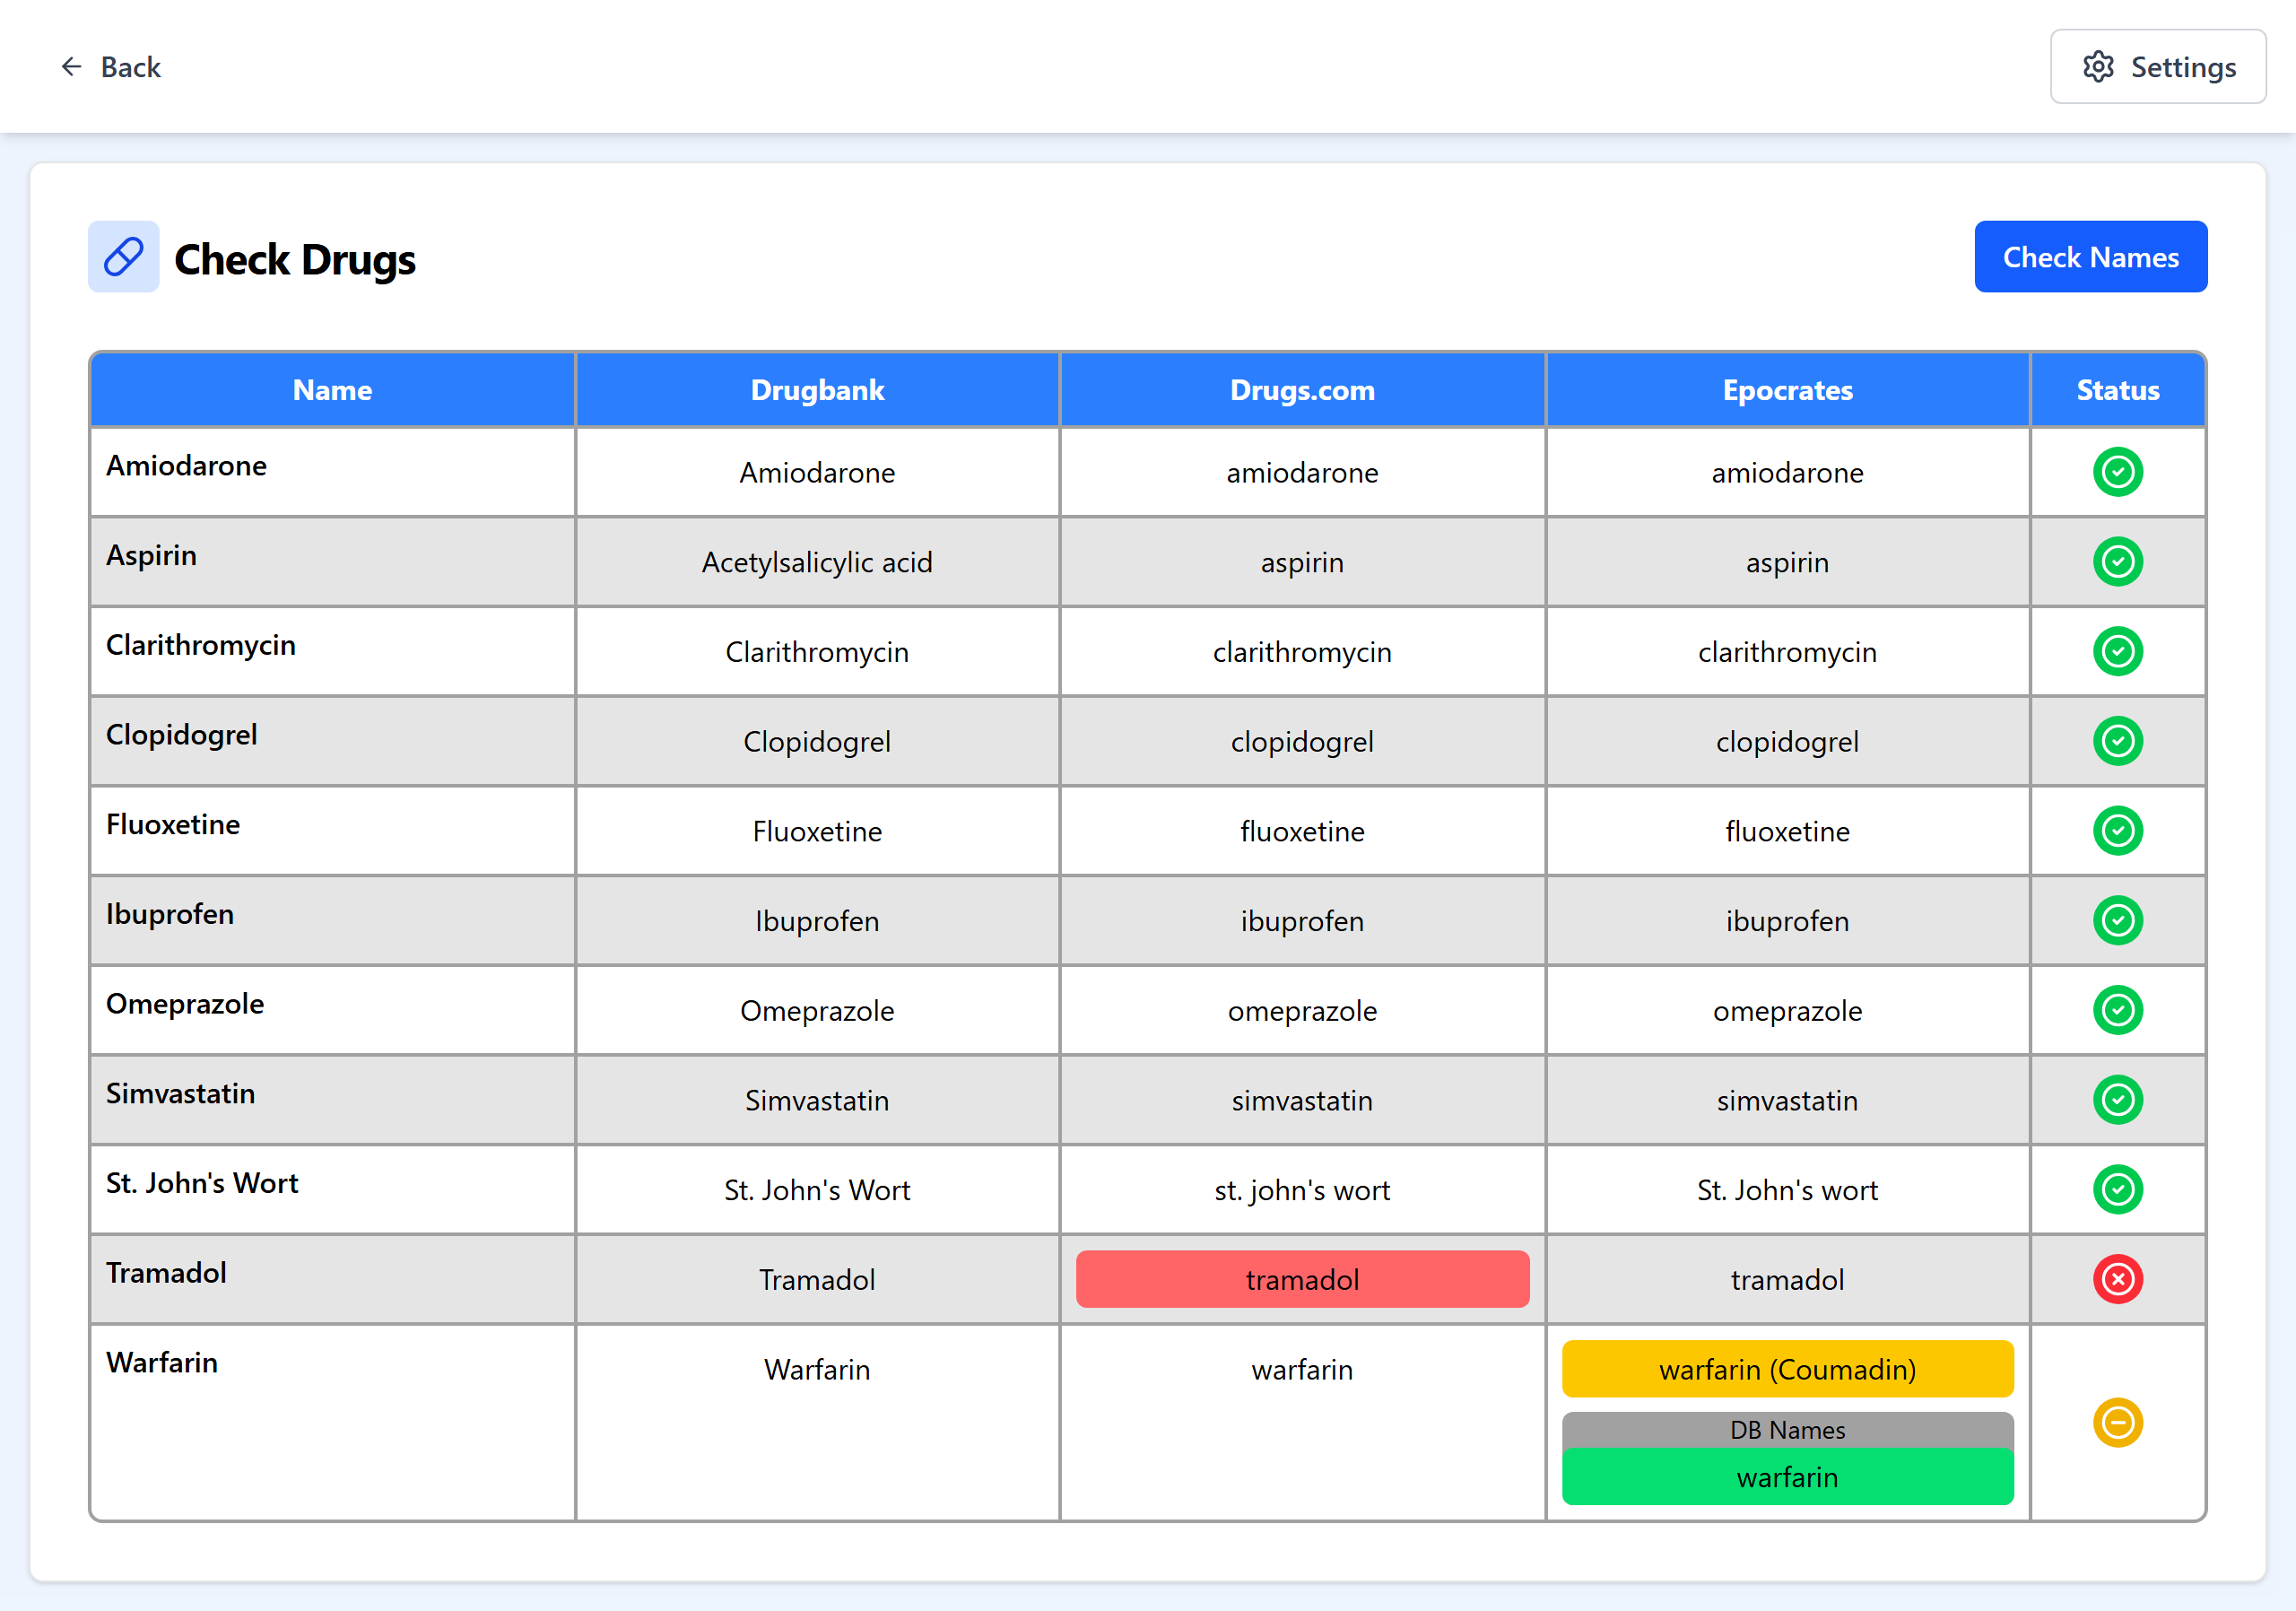
3. Validate the names
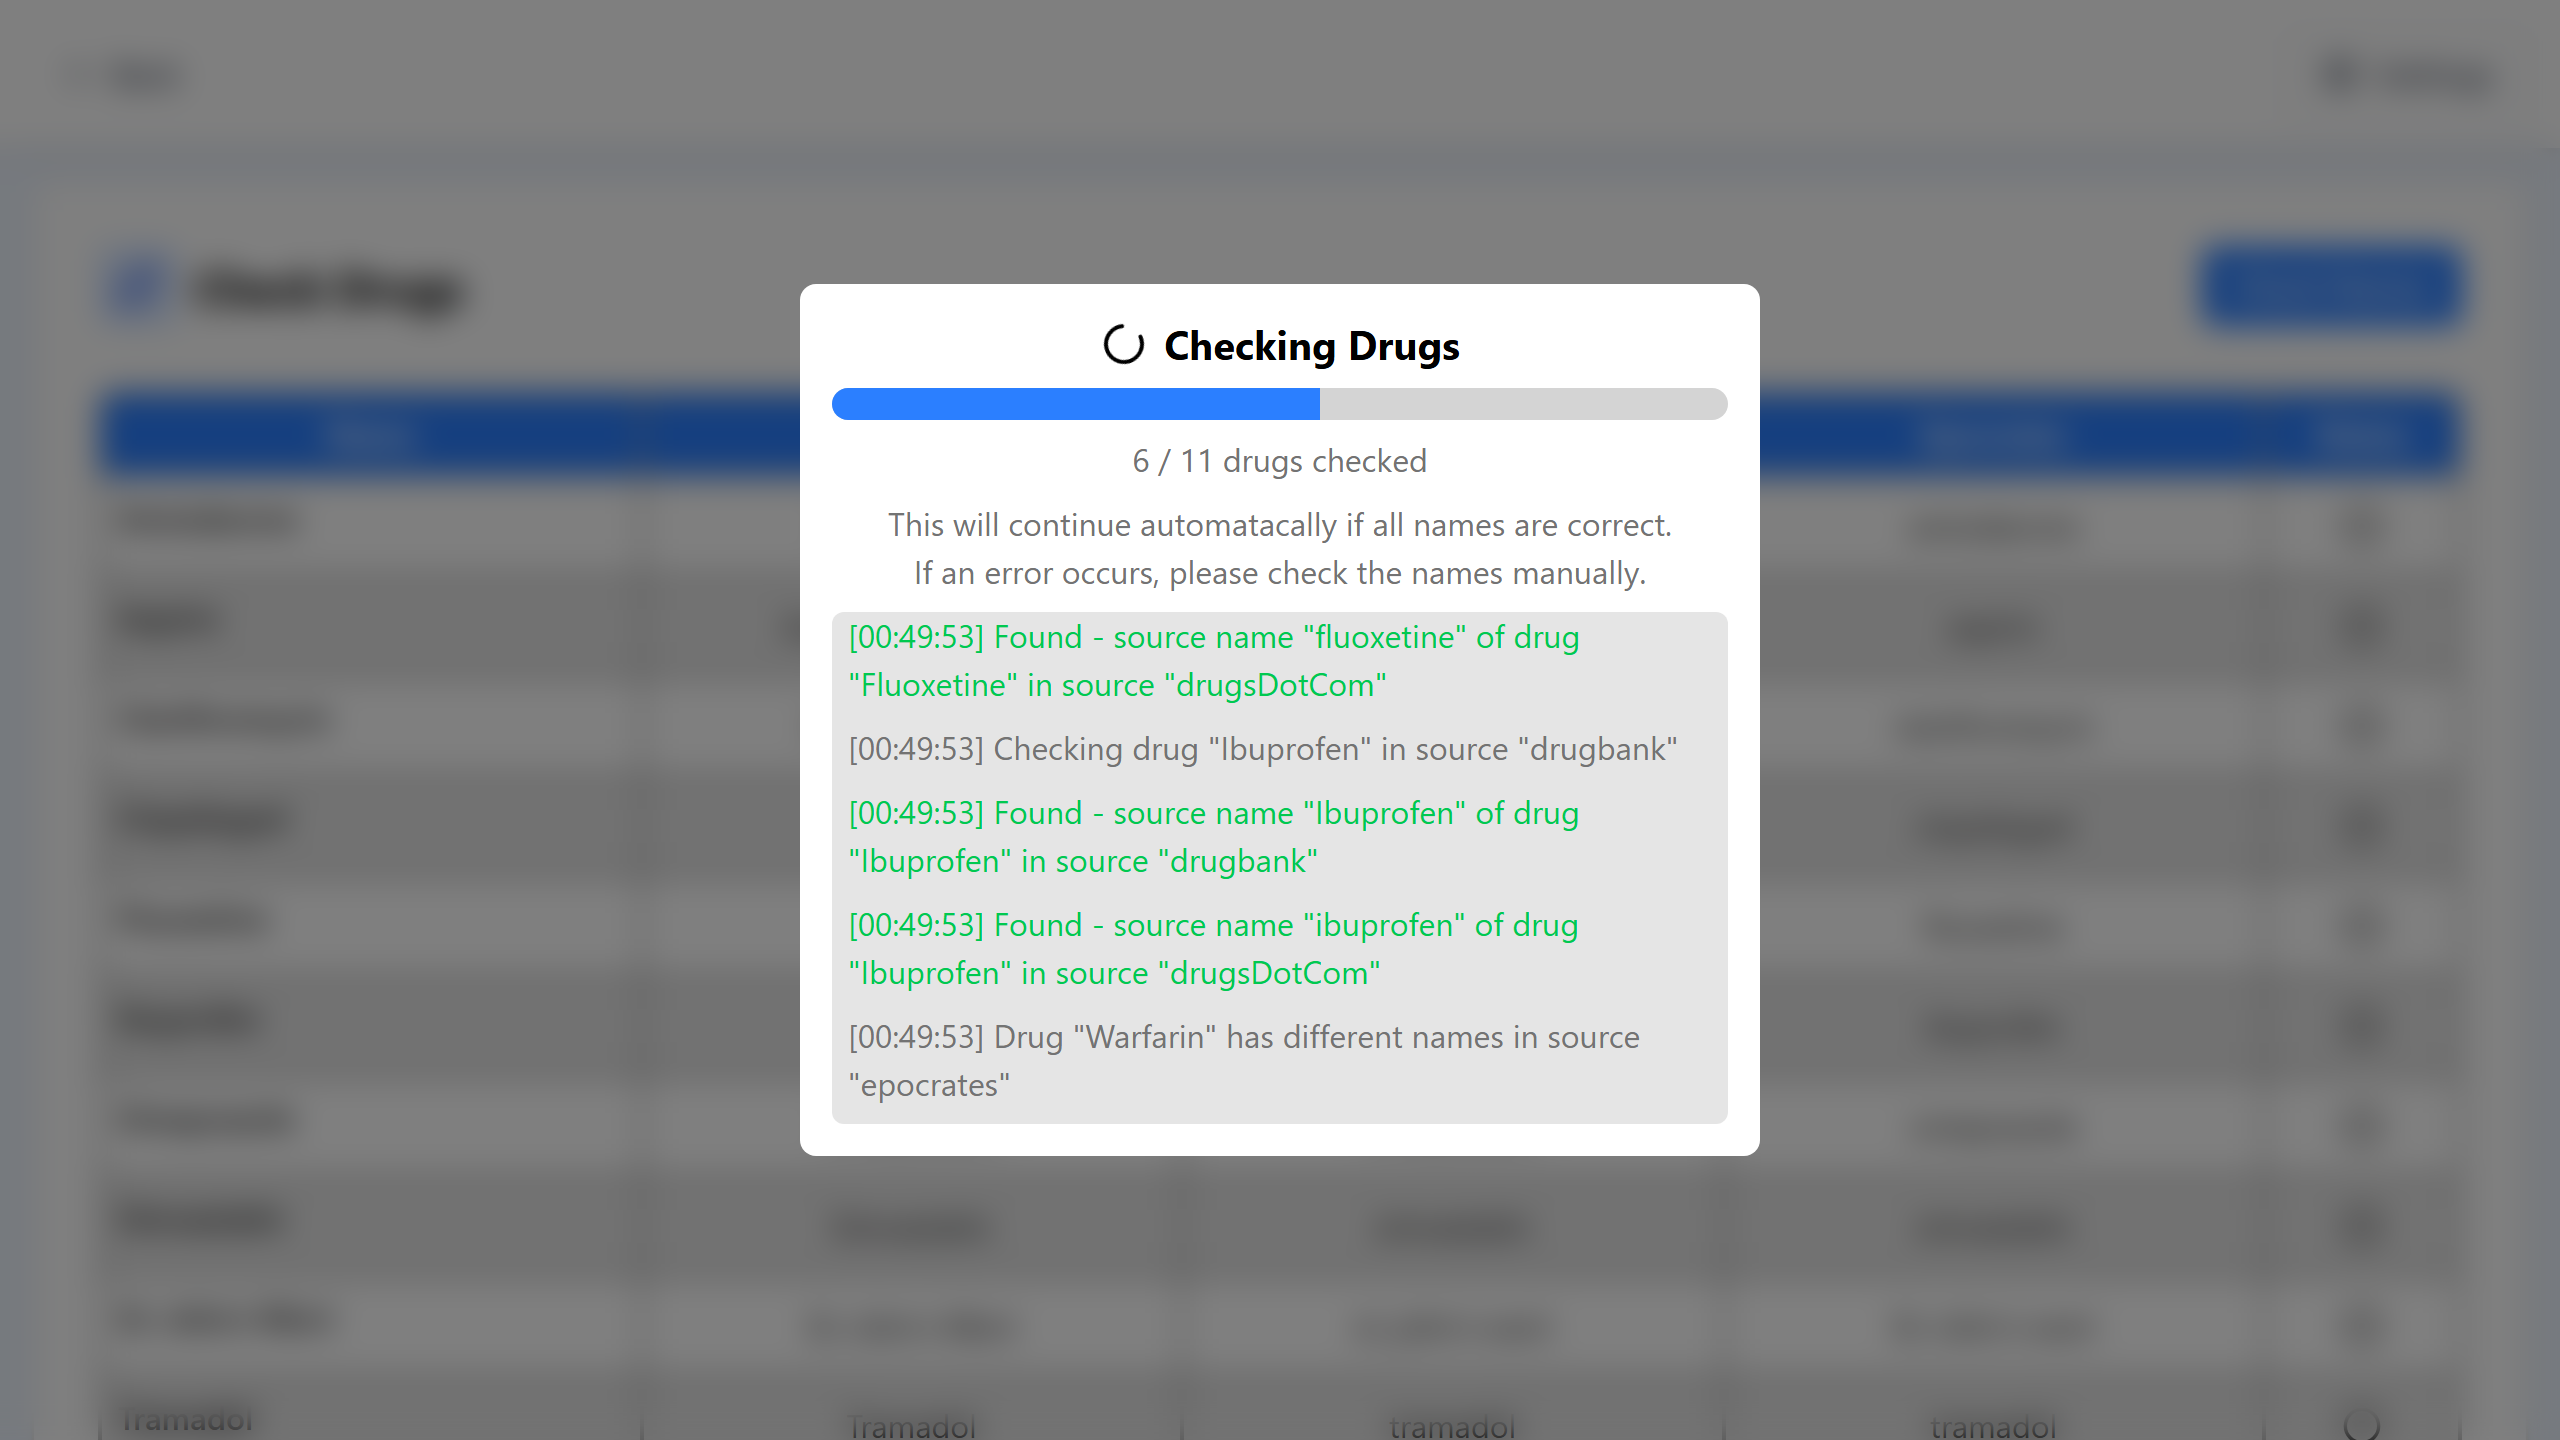
The app checks every alias in each enabled source with fuzzy matching. Green means found, red means not found, and yellow marks a difference from the names already stored for that drug. Saved names remain visible so the user can decide how to proceed. A progress bar and colour-coded log show the work as it runs.
4. Search interactions
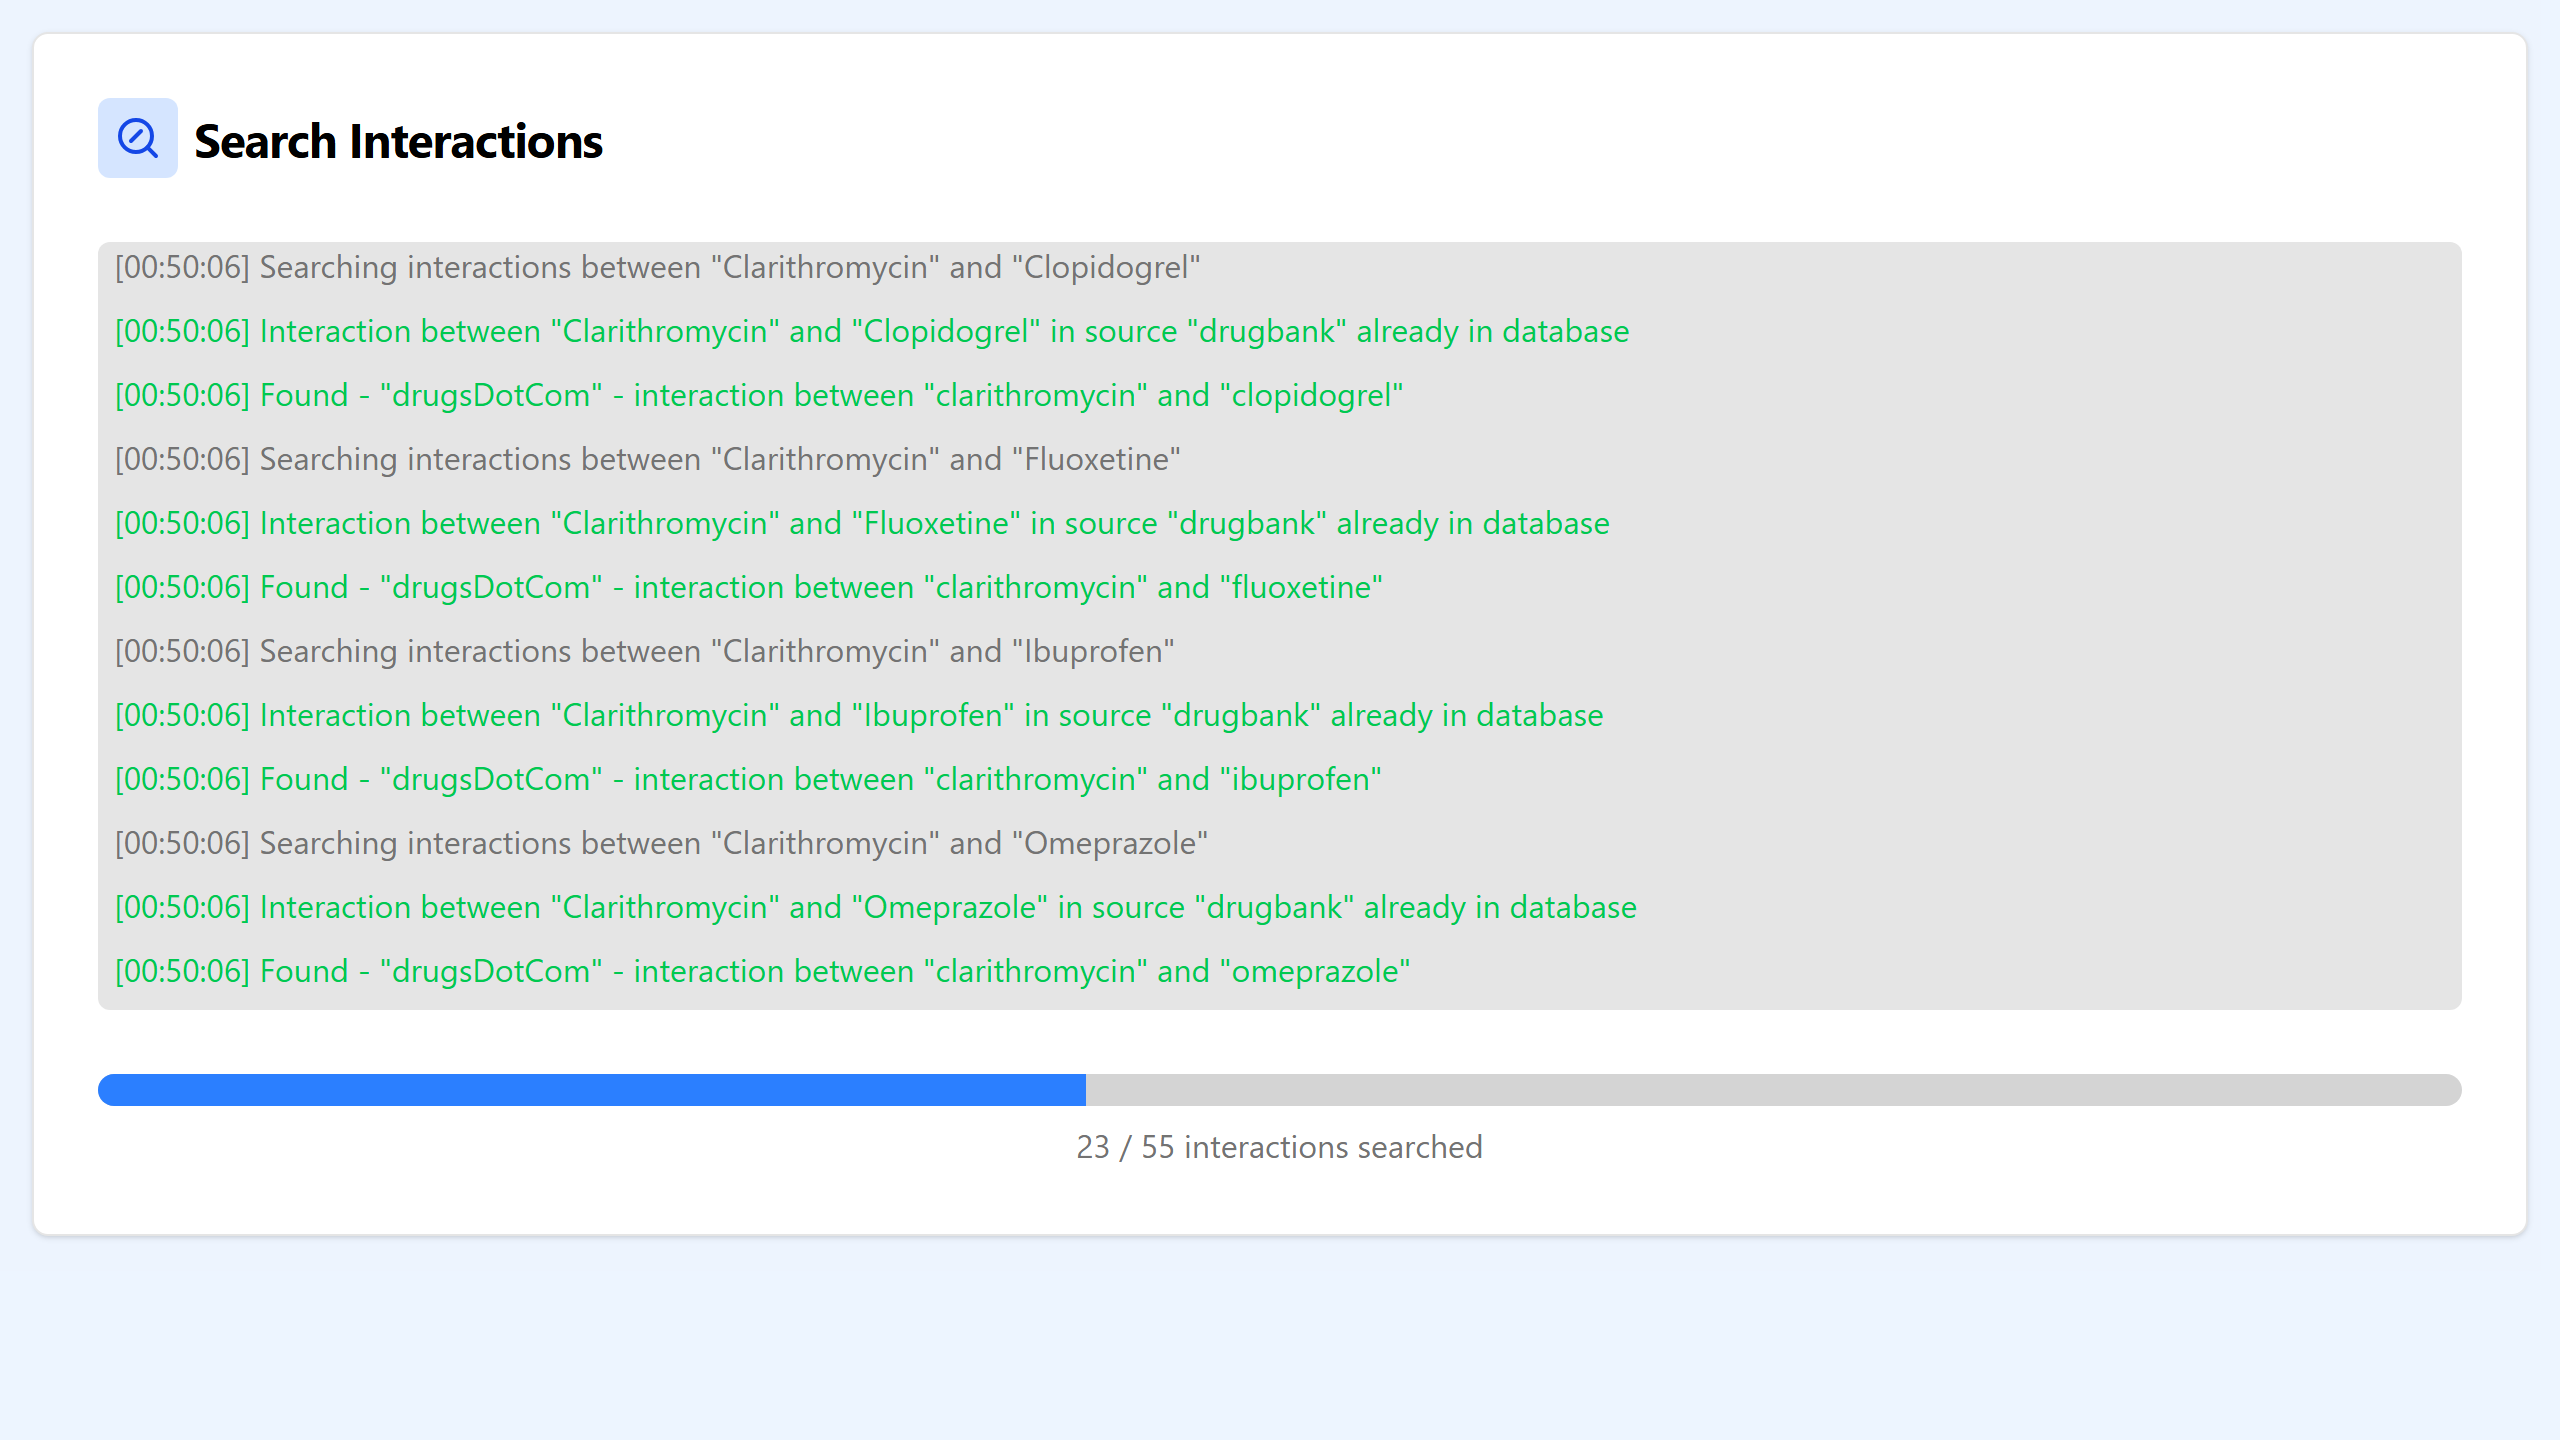
Every pair is checked across the enabled sources. Pairs searched within the last year are reused from PostgreSQL; only missing or out-of-date results require a live search. Live requests run through a shared browser and VPN connection, with streamed progress and retries.
5. Generate the PowerPoint
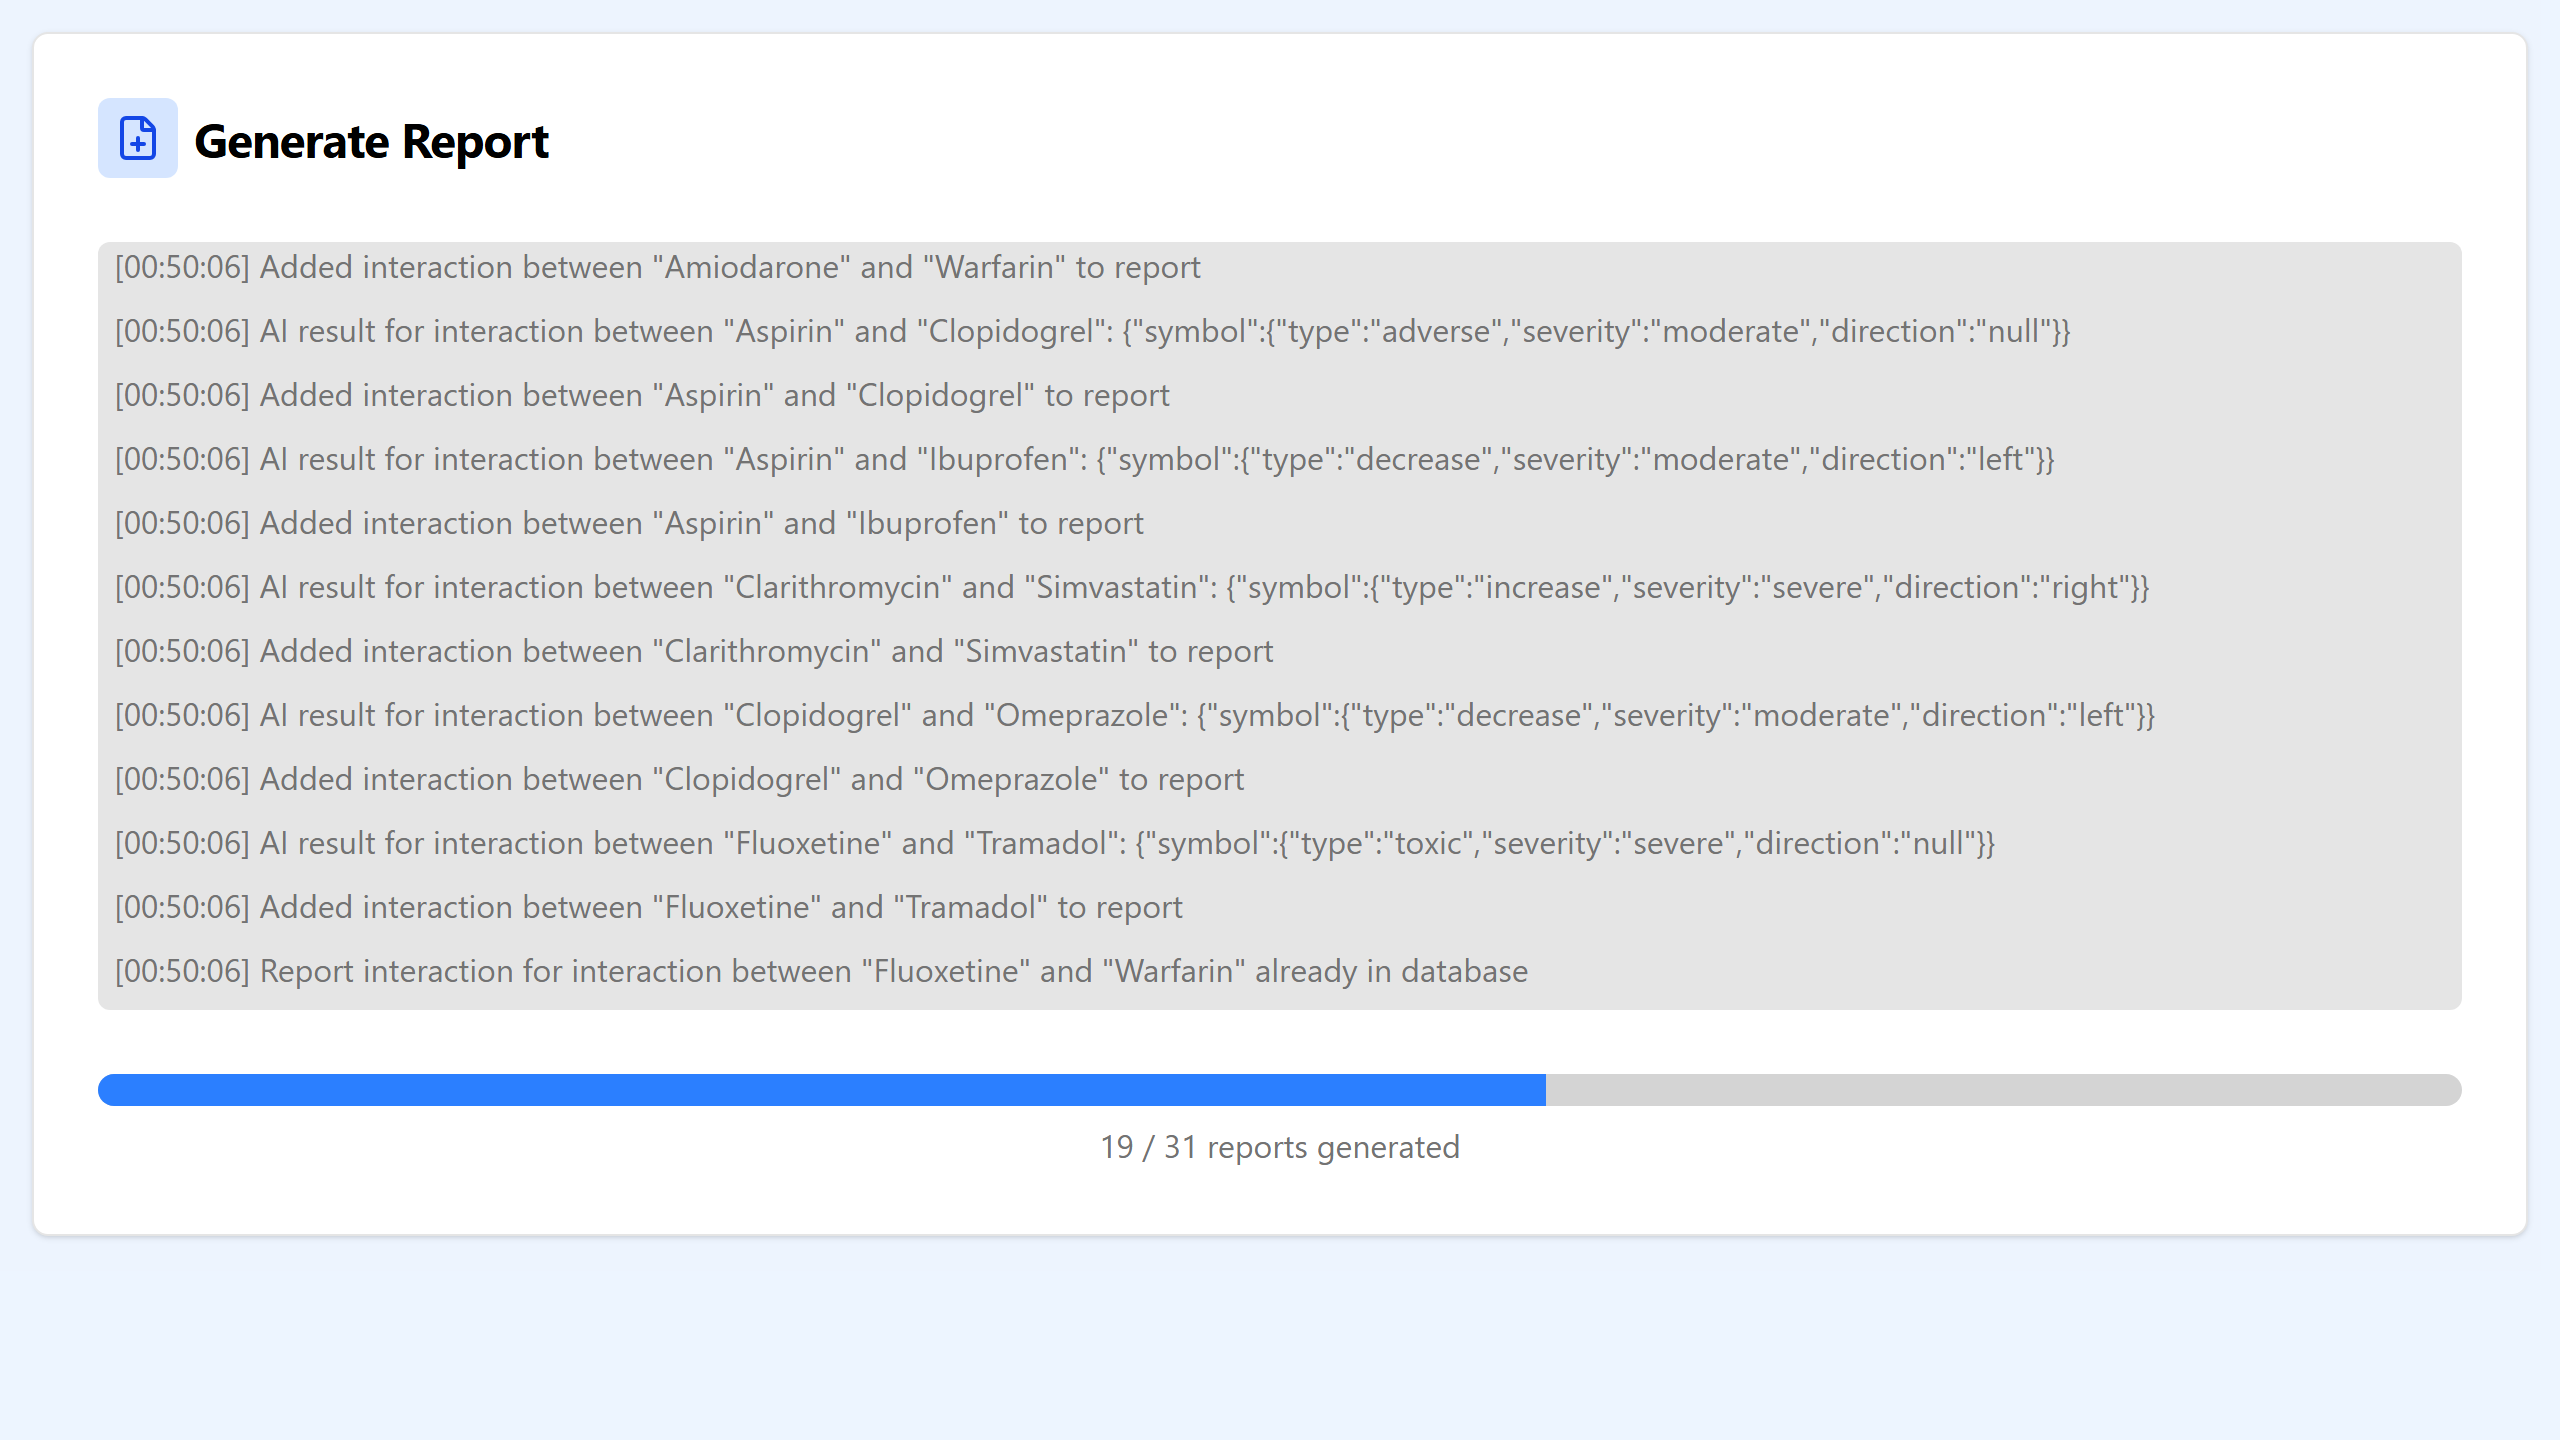
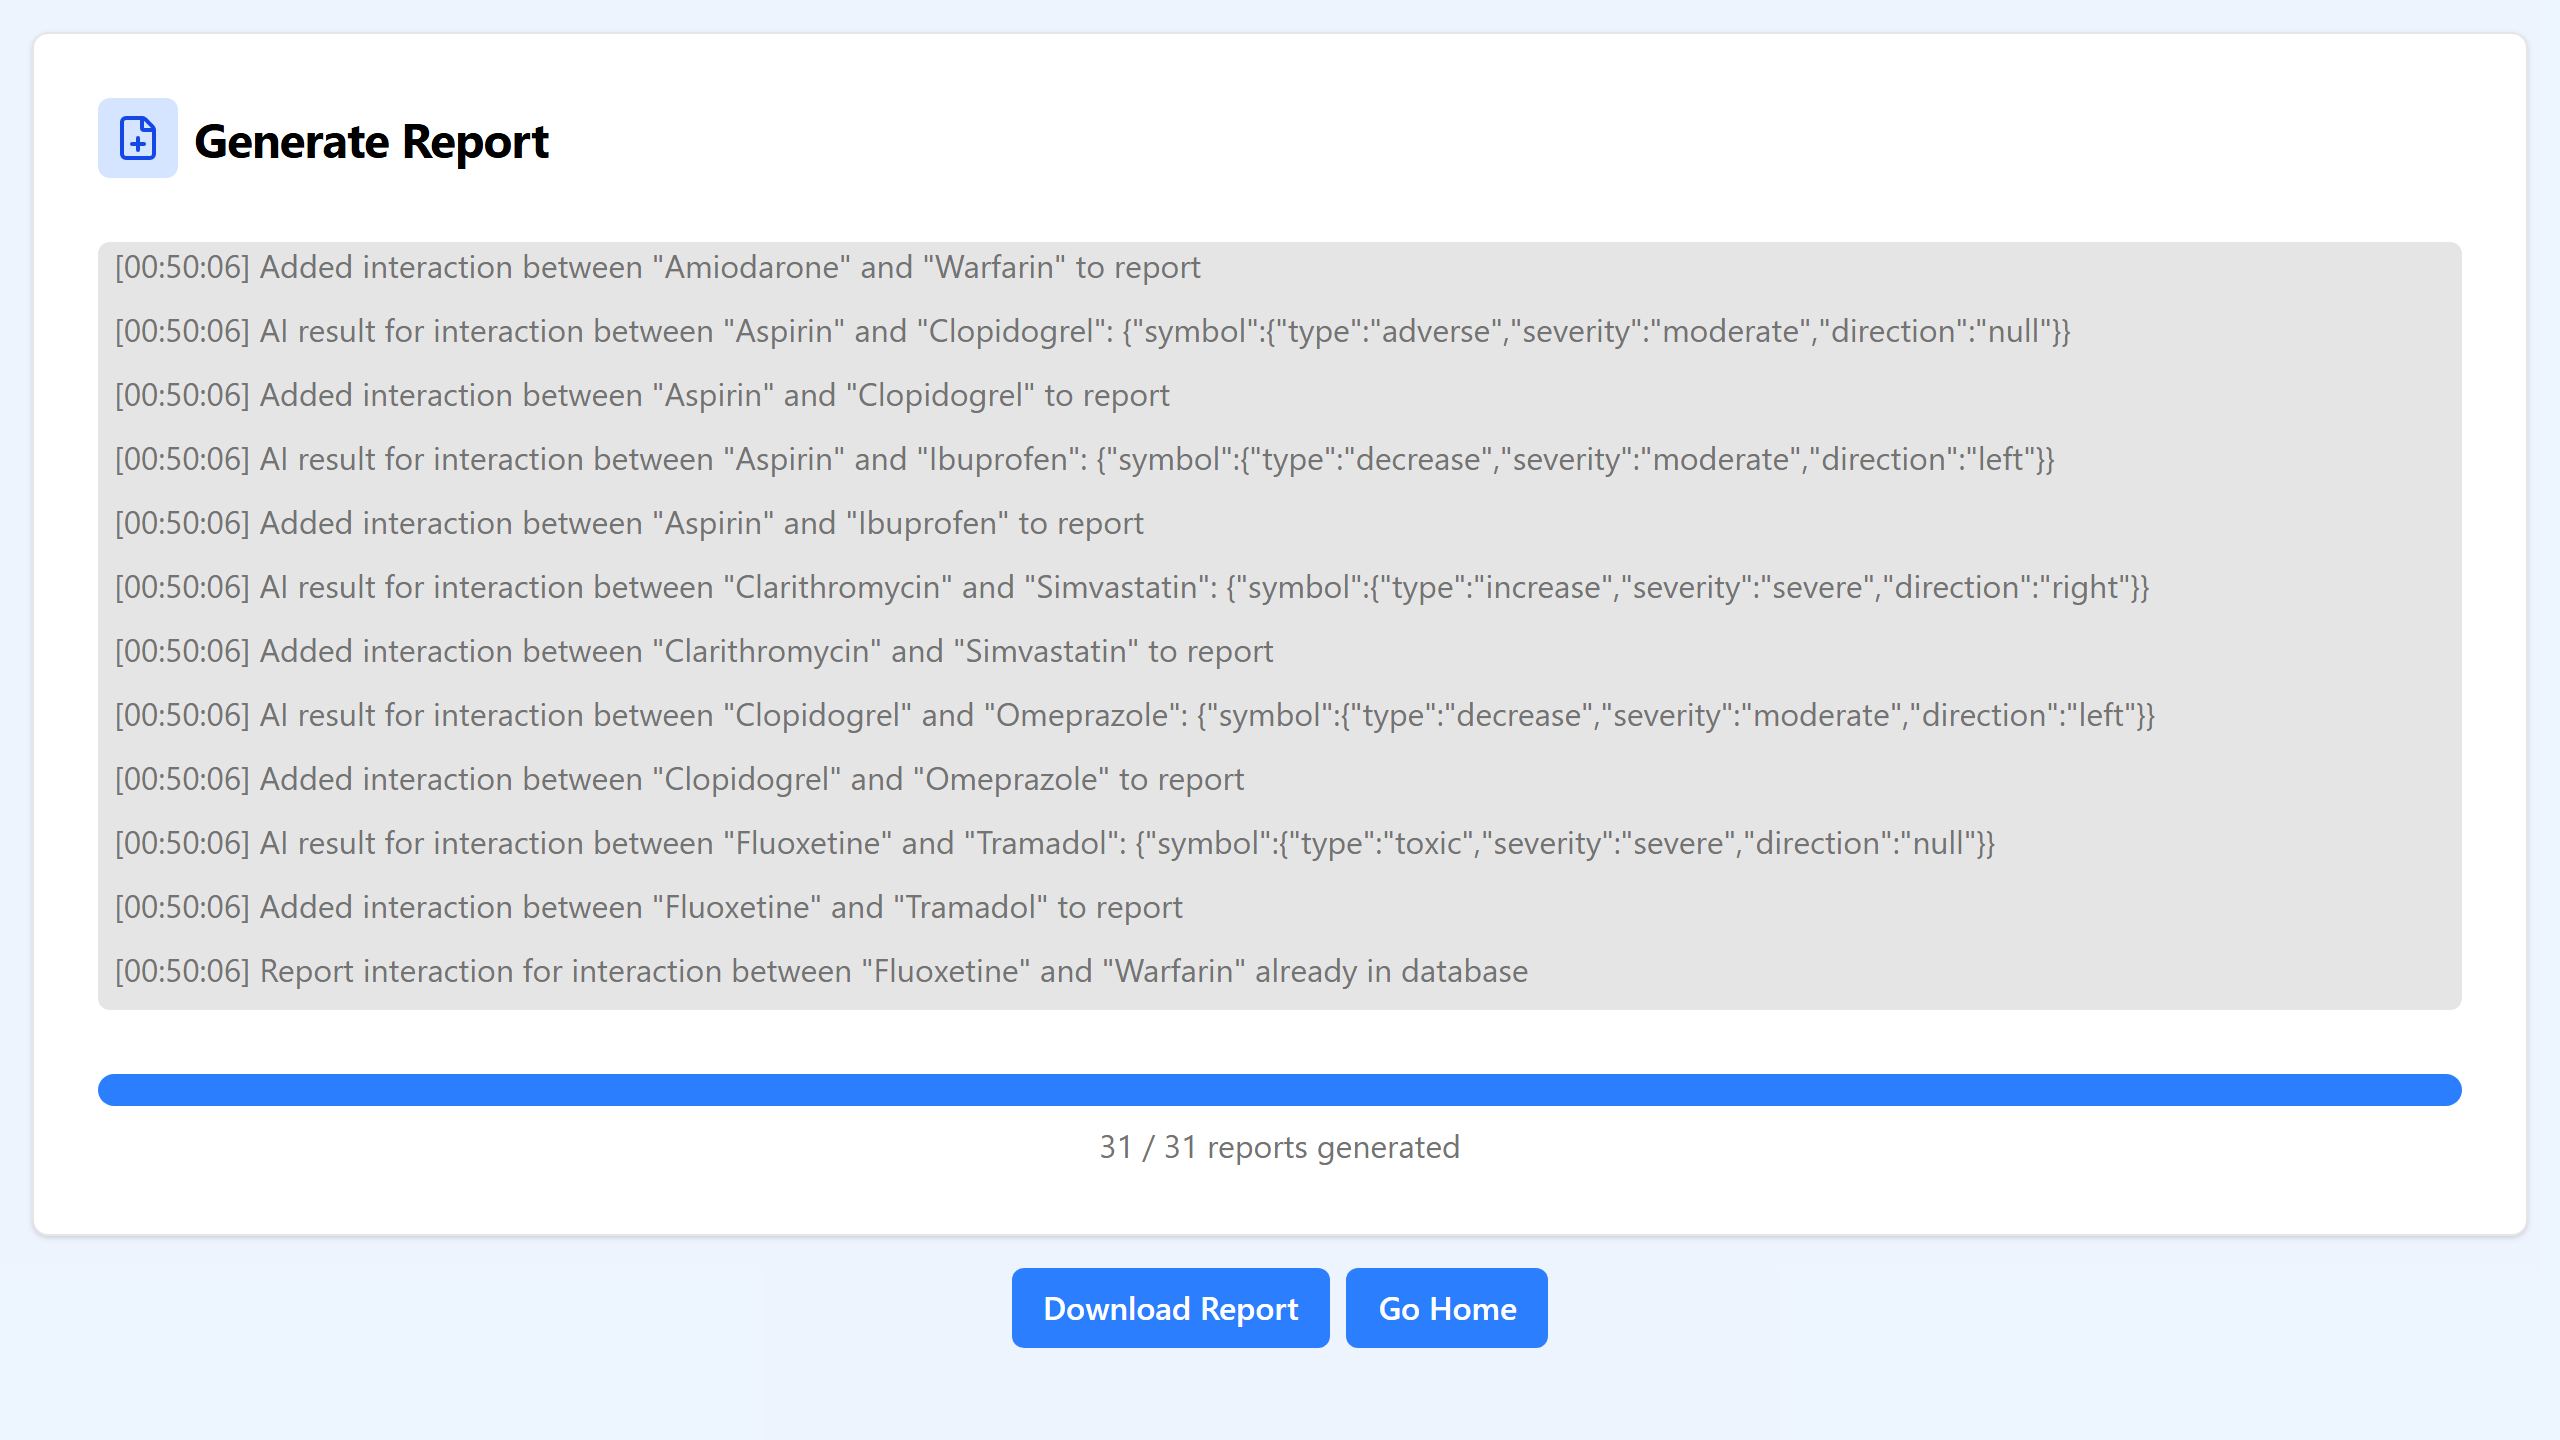
For each pair, the app first reuses a human-reviewed result when one exists. Otherwise, the fine-tuned model proposes a symbol and quotes the source sentences supporting it. The generated deck includes a cover, index, substance covers, and interaction slides with highlighted evidence for the reviewer.
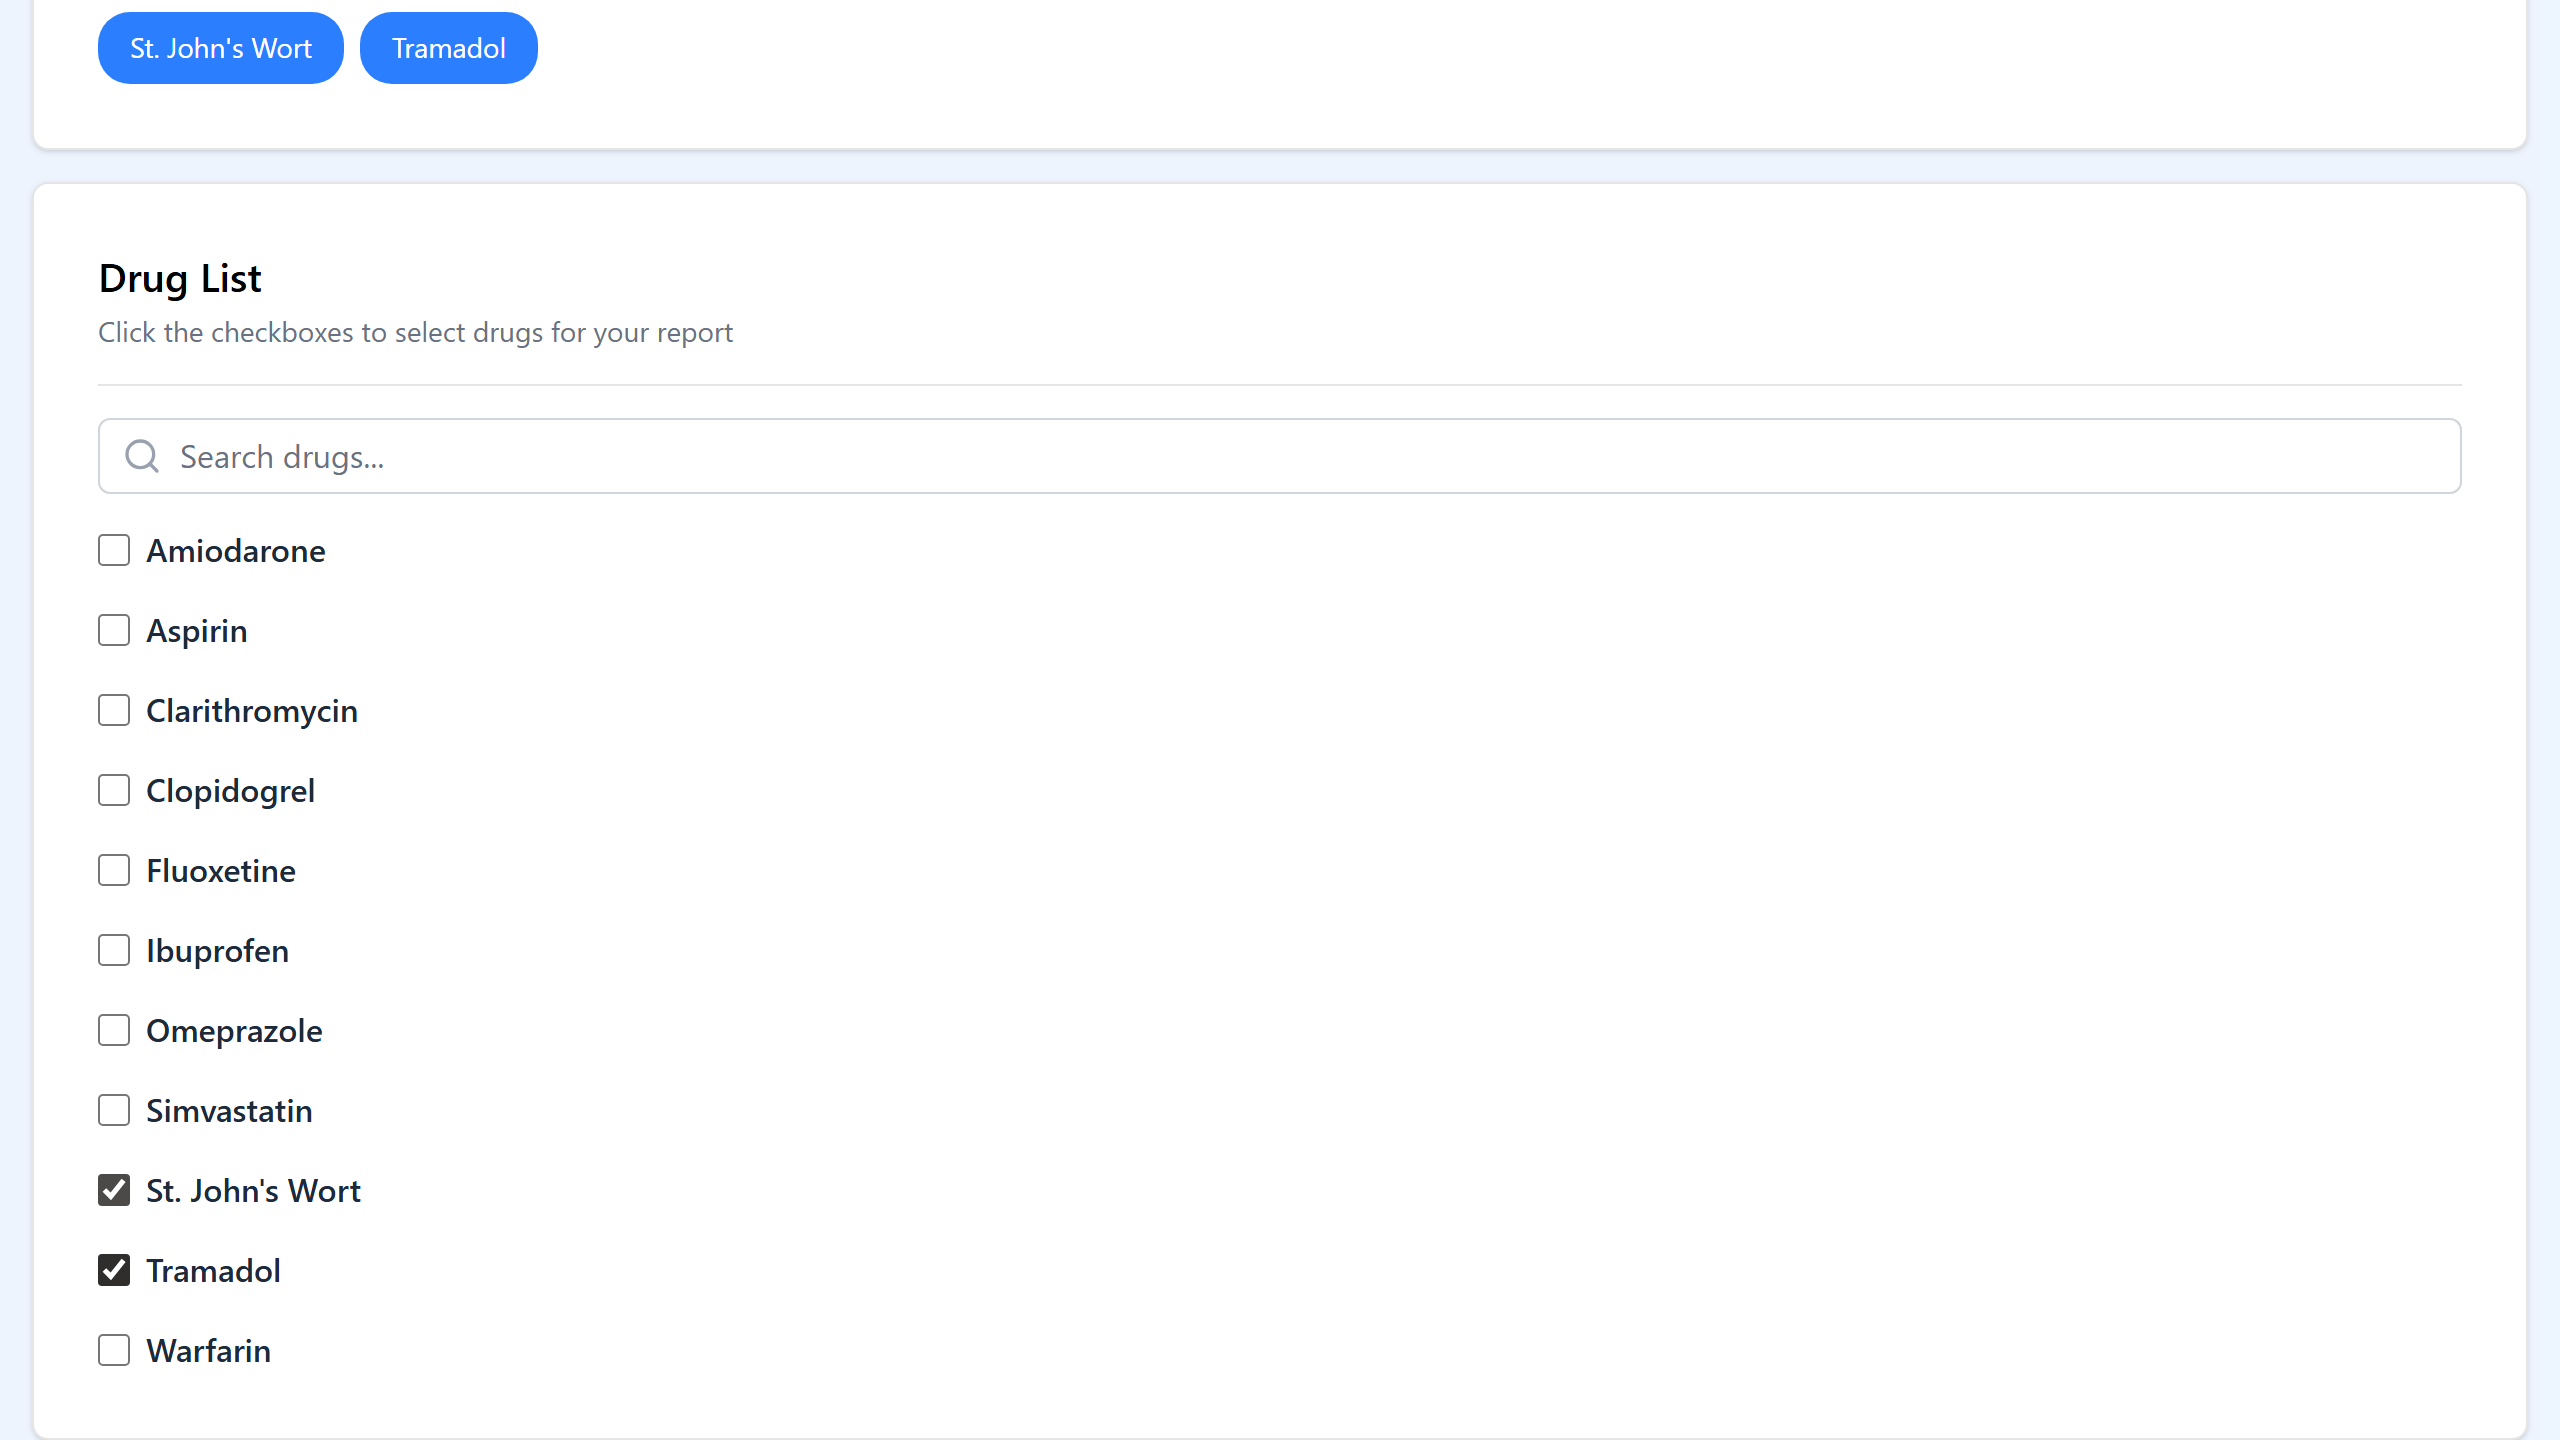
Add substances without repeating the full report
Partial reports let users select only newly added substances. The app searches pairs involving those additions, avoiding another complete run over the existing list.
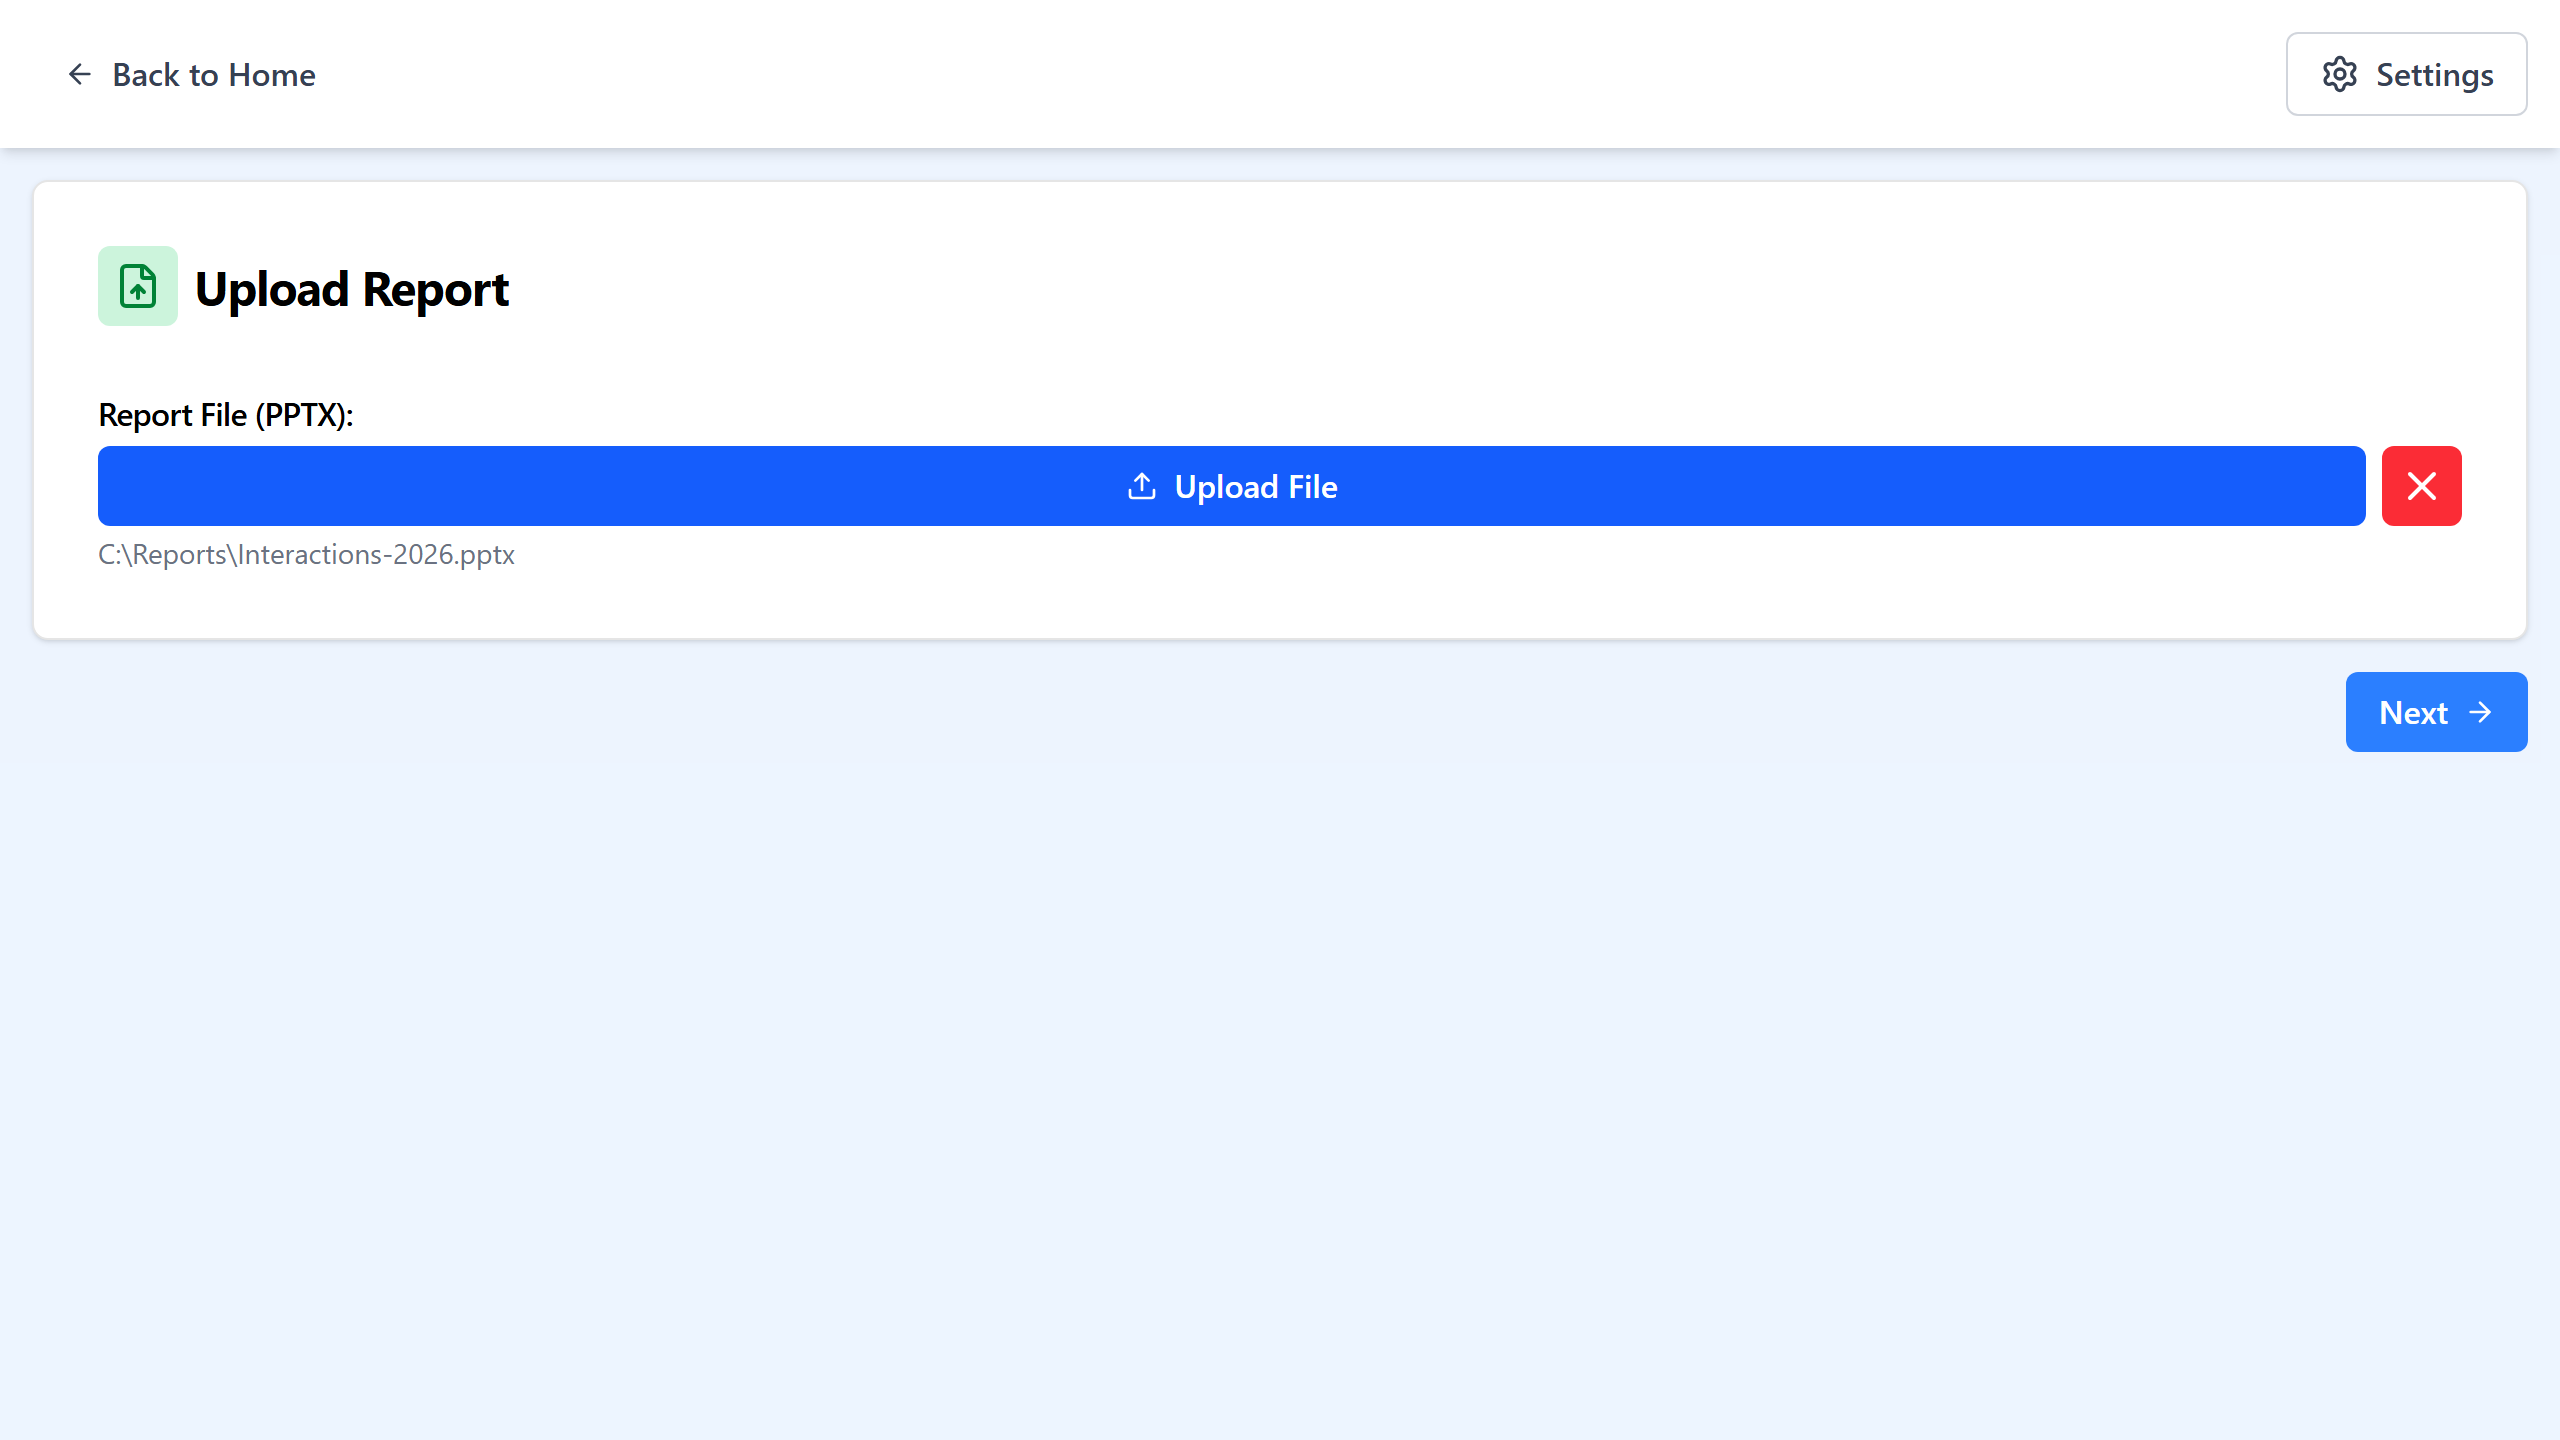
Bring reviewed decisions back into the database
Users can upload an edited PPTX after review. The app parses slide XML, recognises the interaction symbol through image comparison, and stores the reviewed result. Future reports reuse that result before asking the AI again.
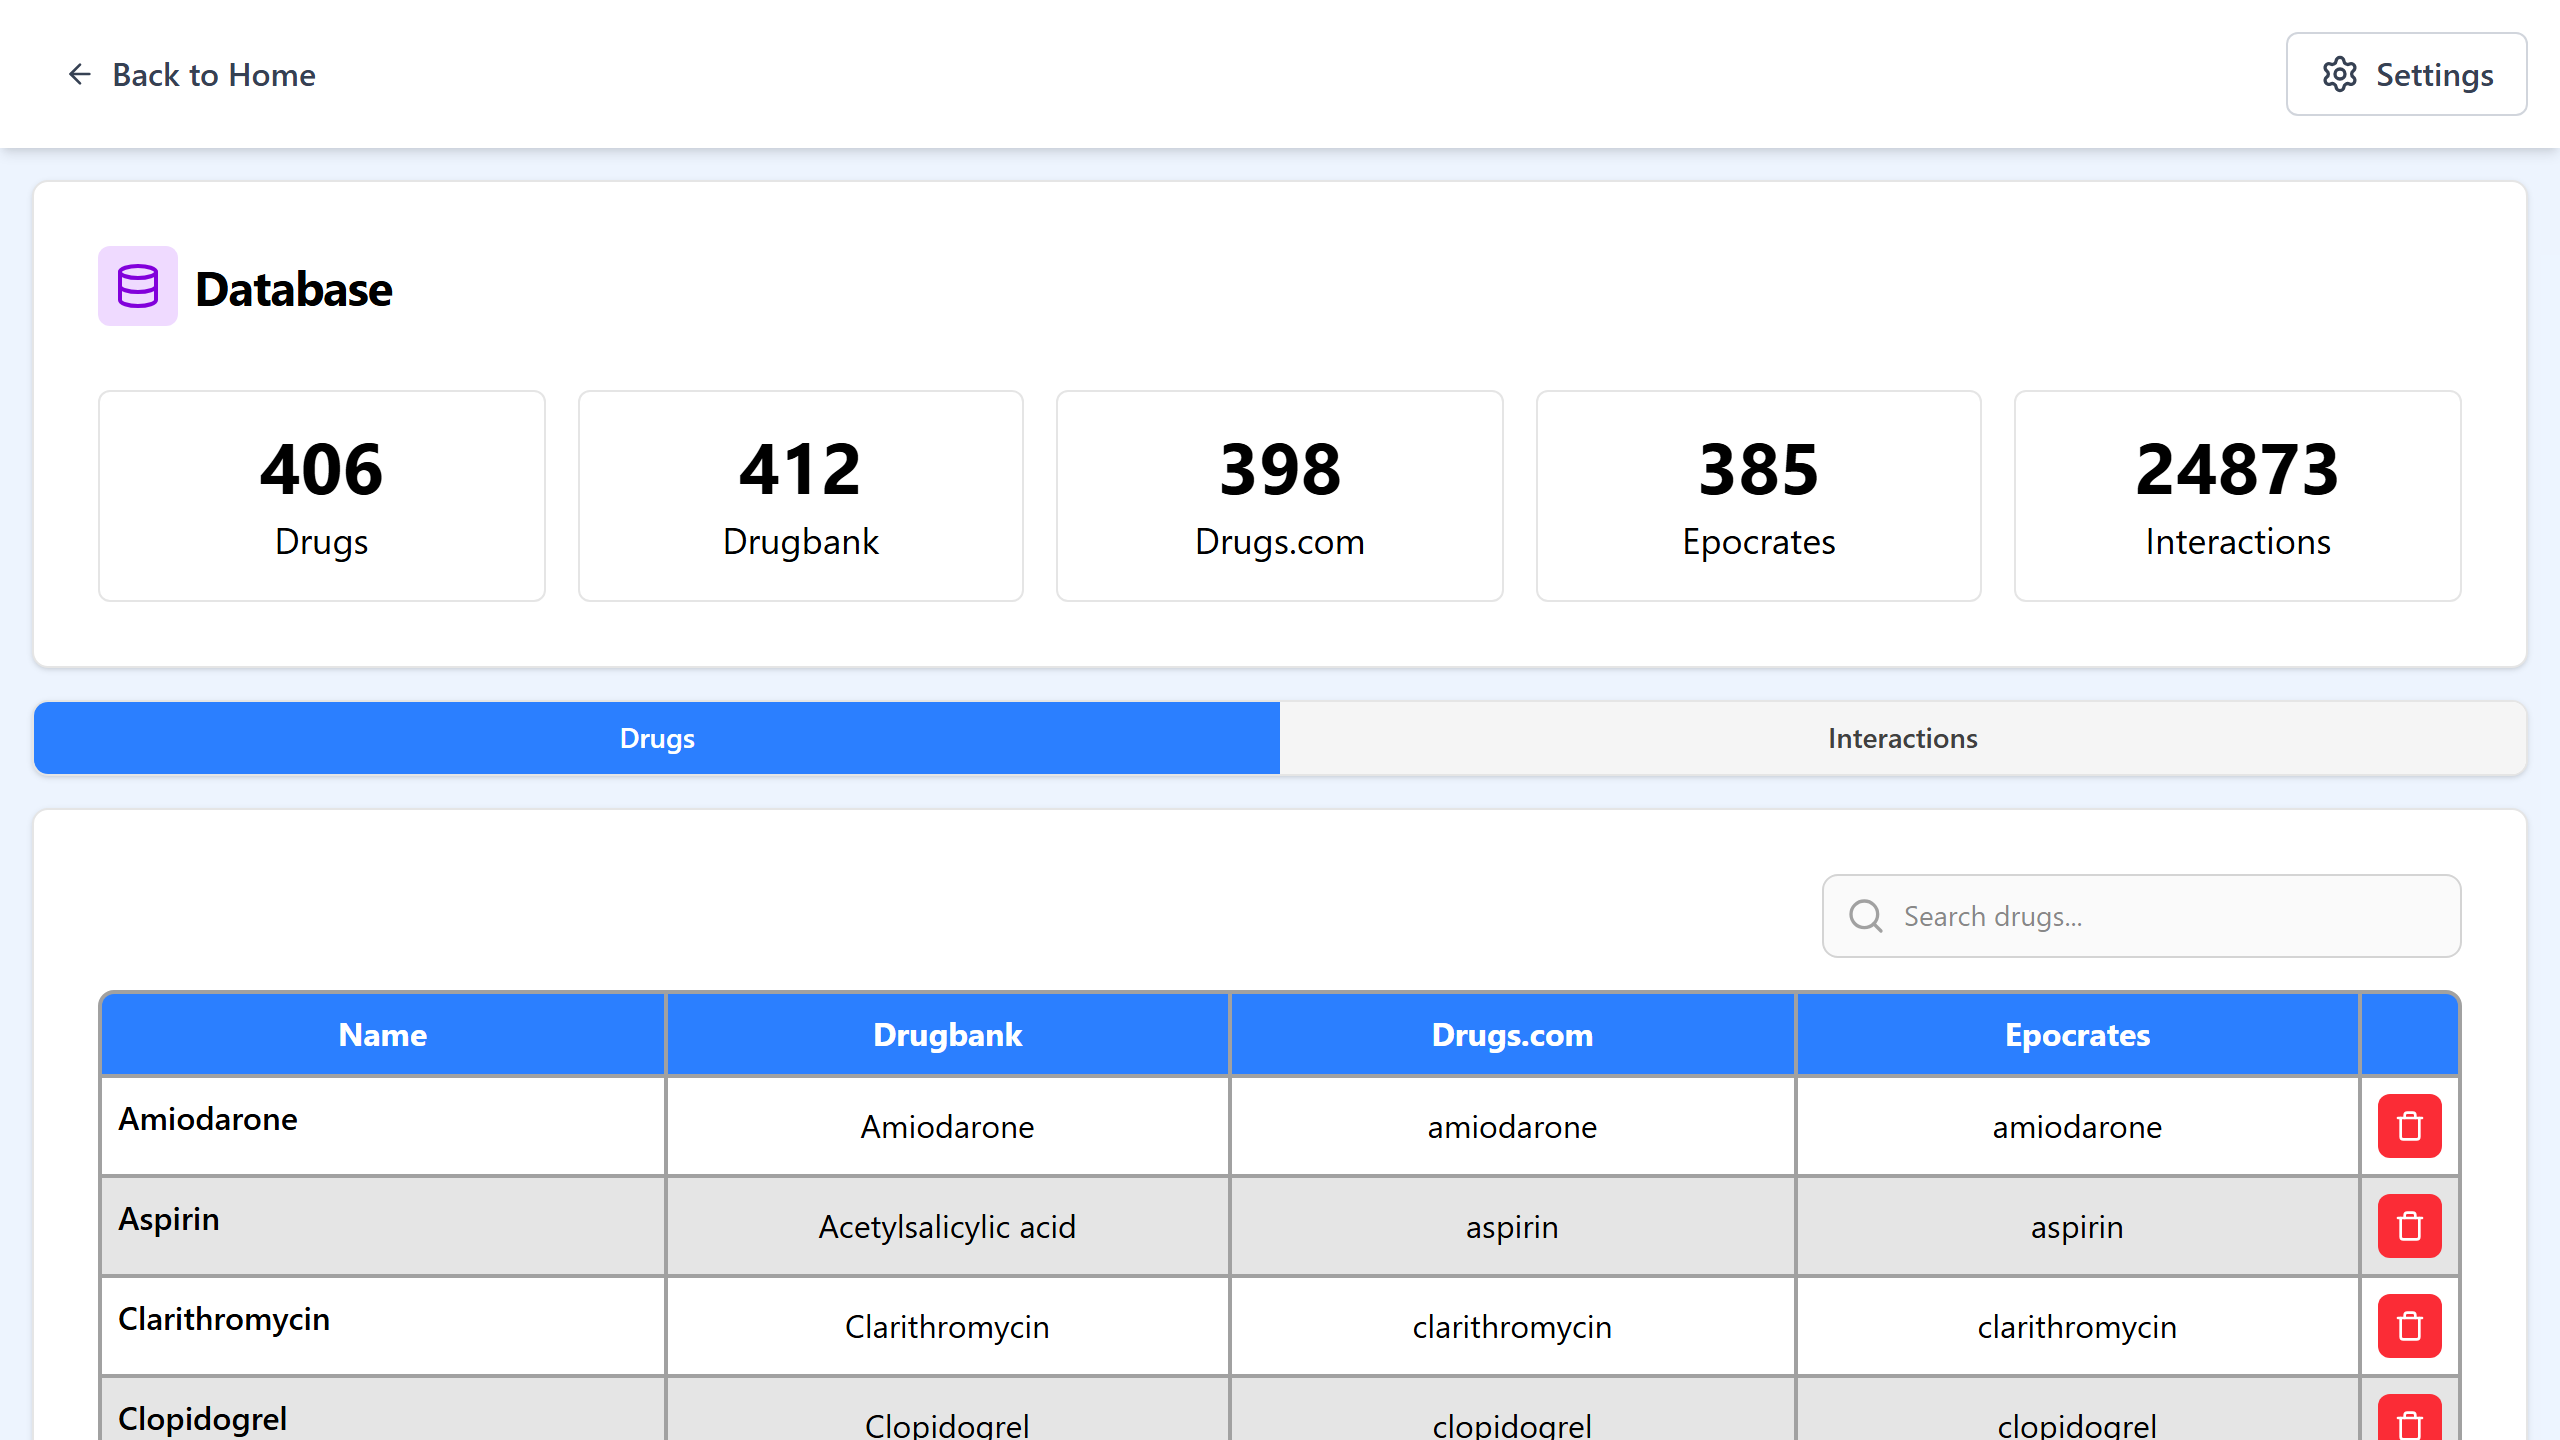
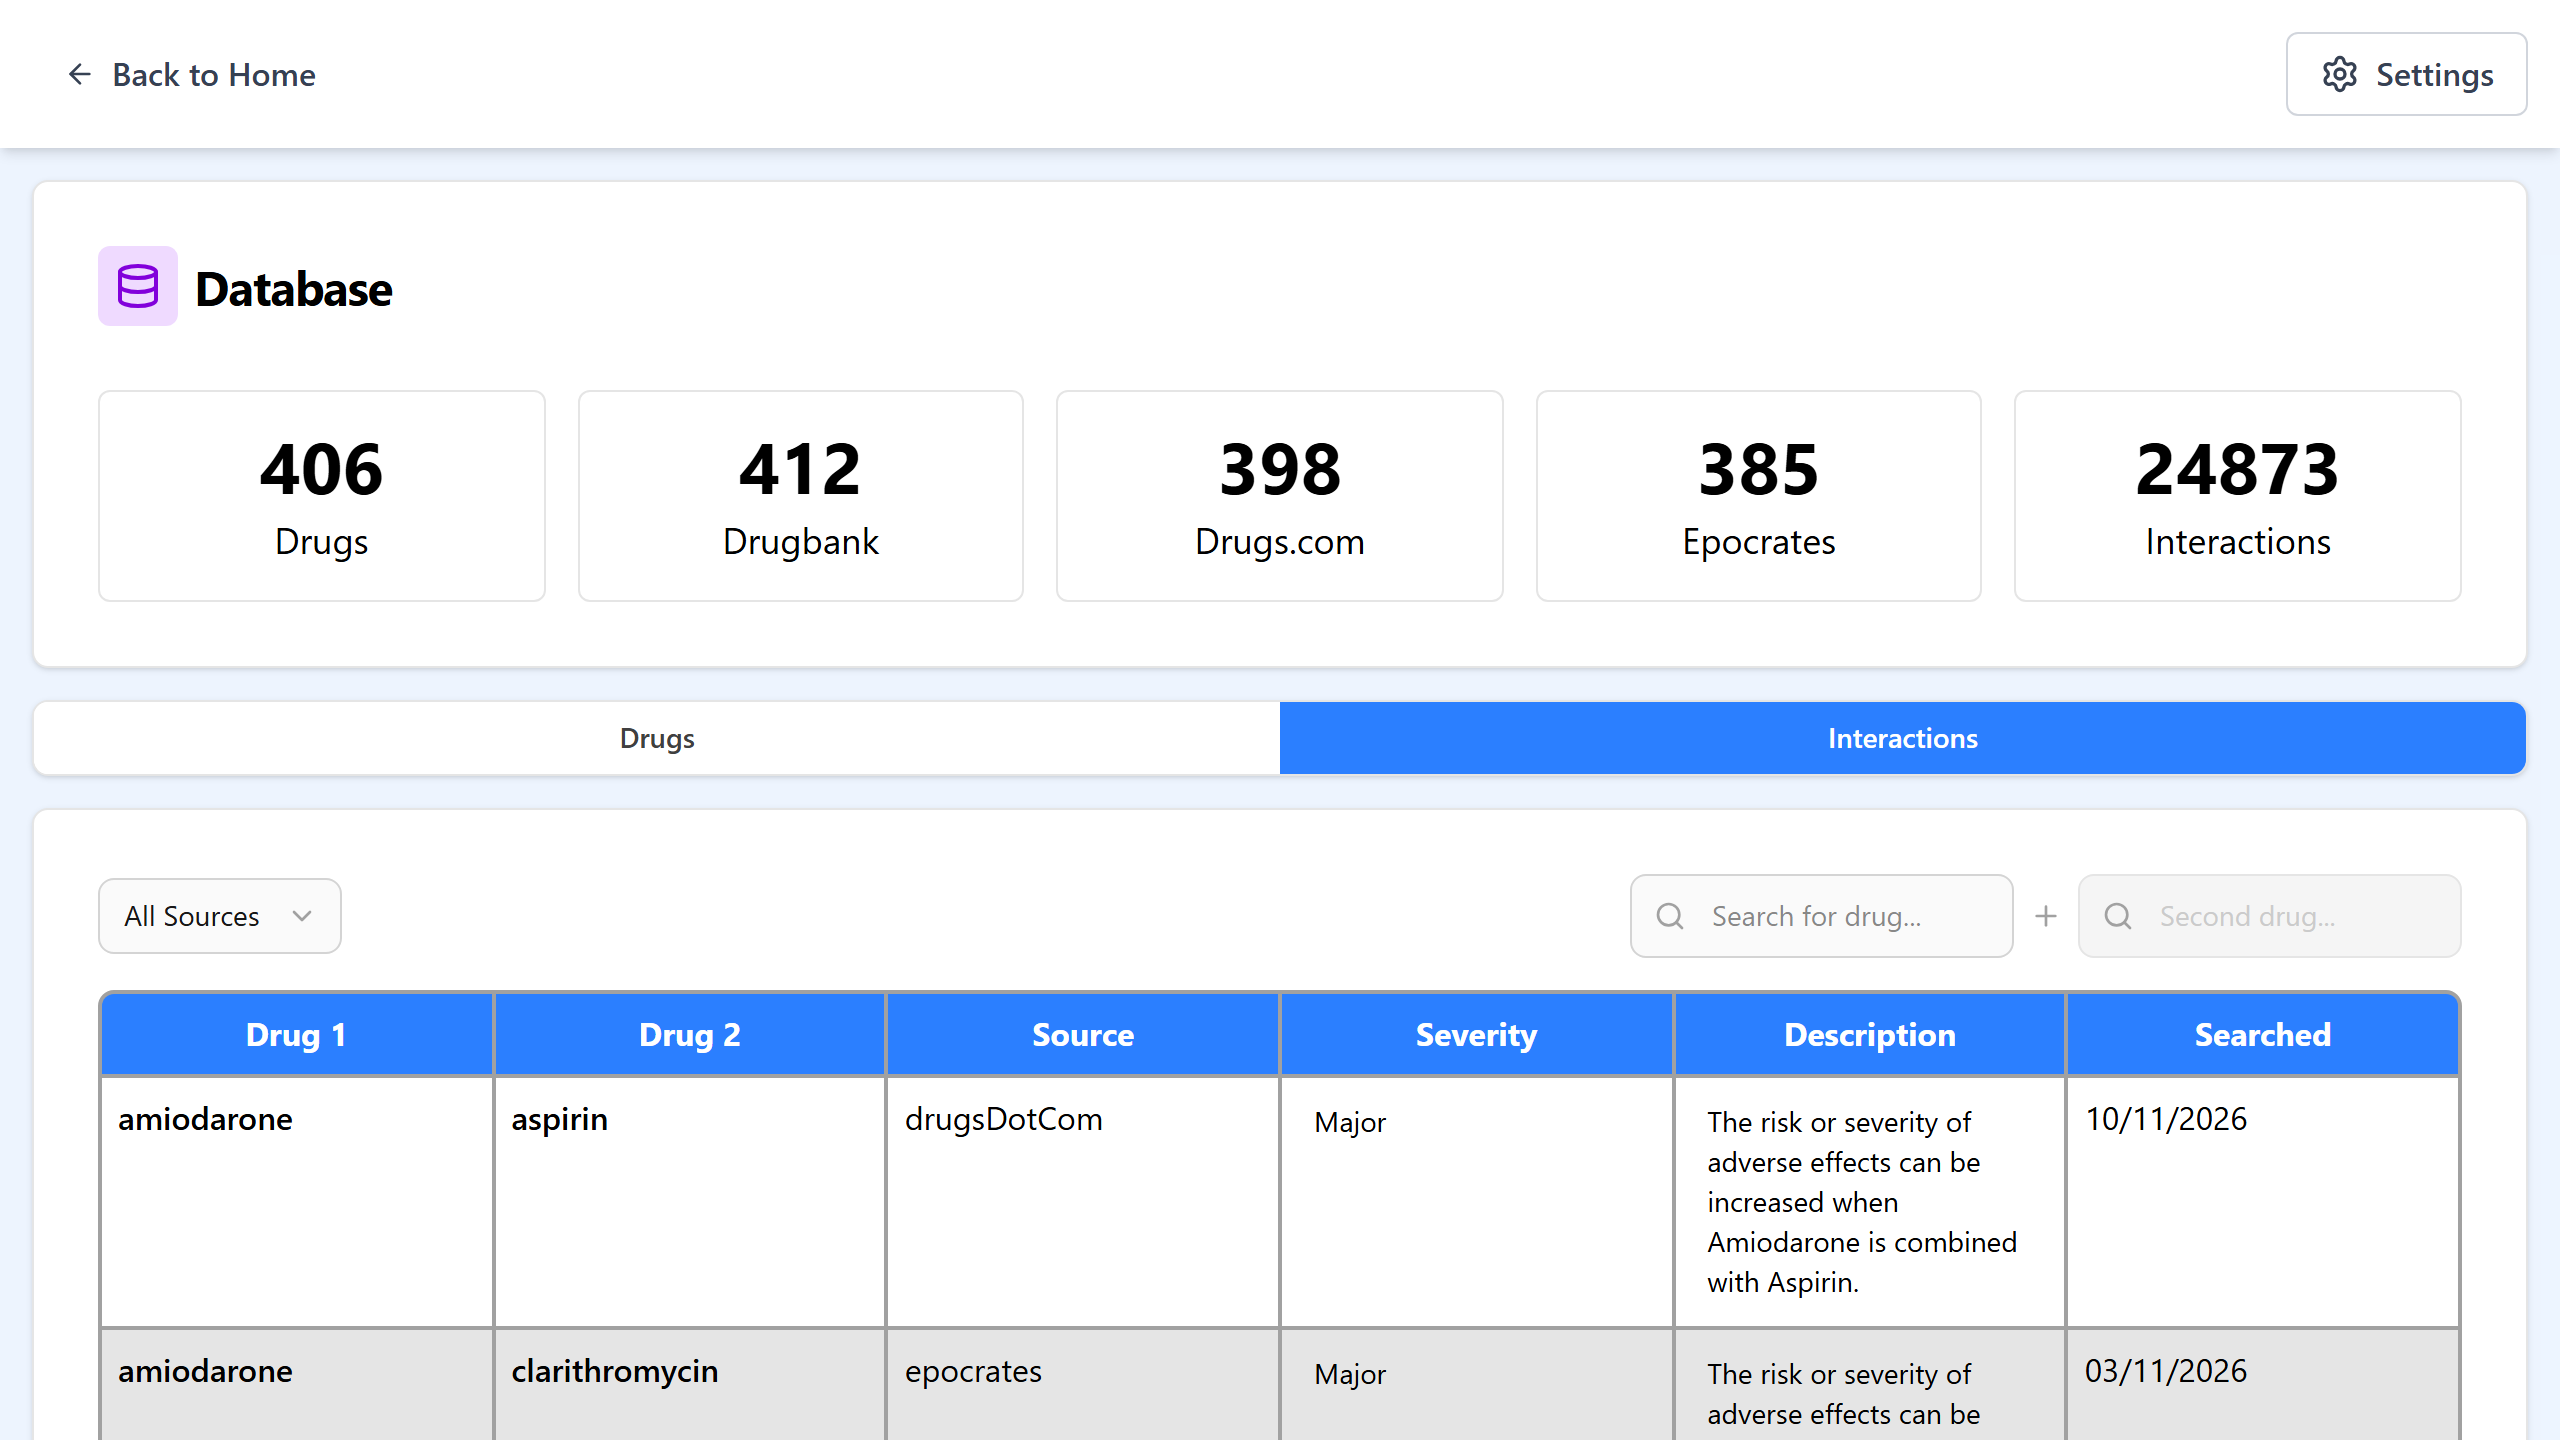
Inspect the stored data
The database browser shows totals per source, a searchable drug list with source-specific names and deletion controls, and an interaction table filterable by source and drug pair.
Control the search sources
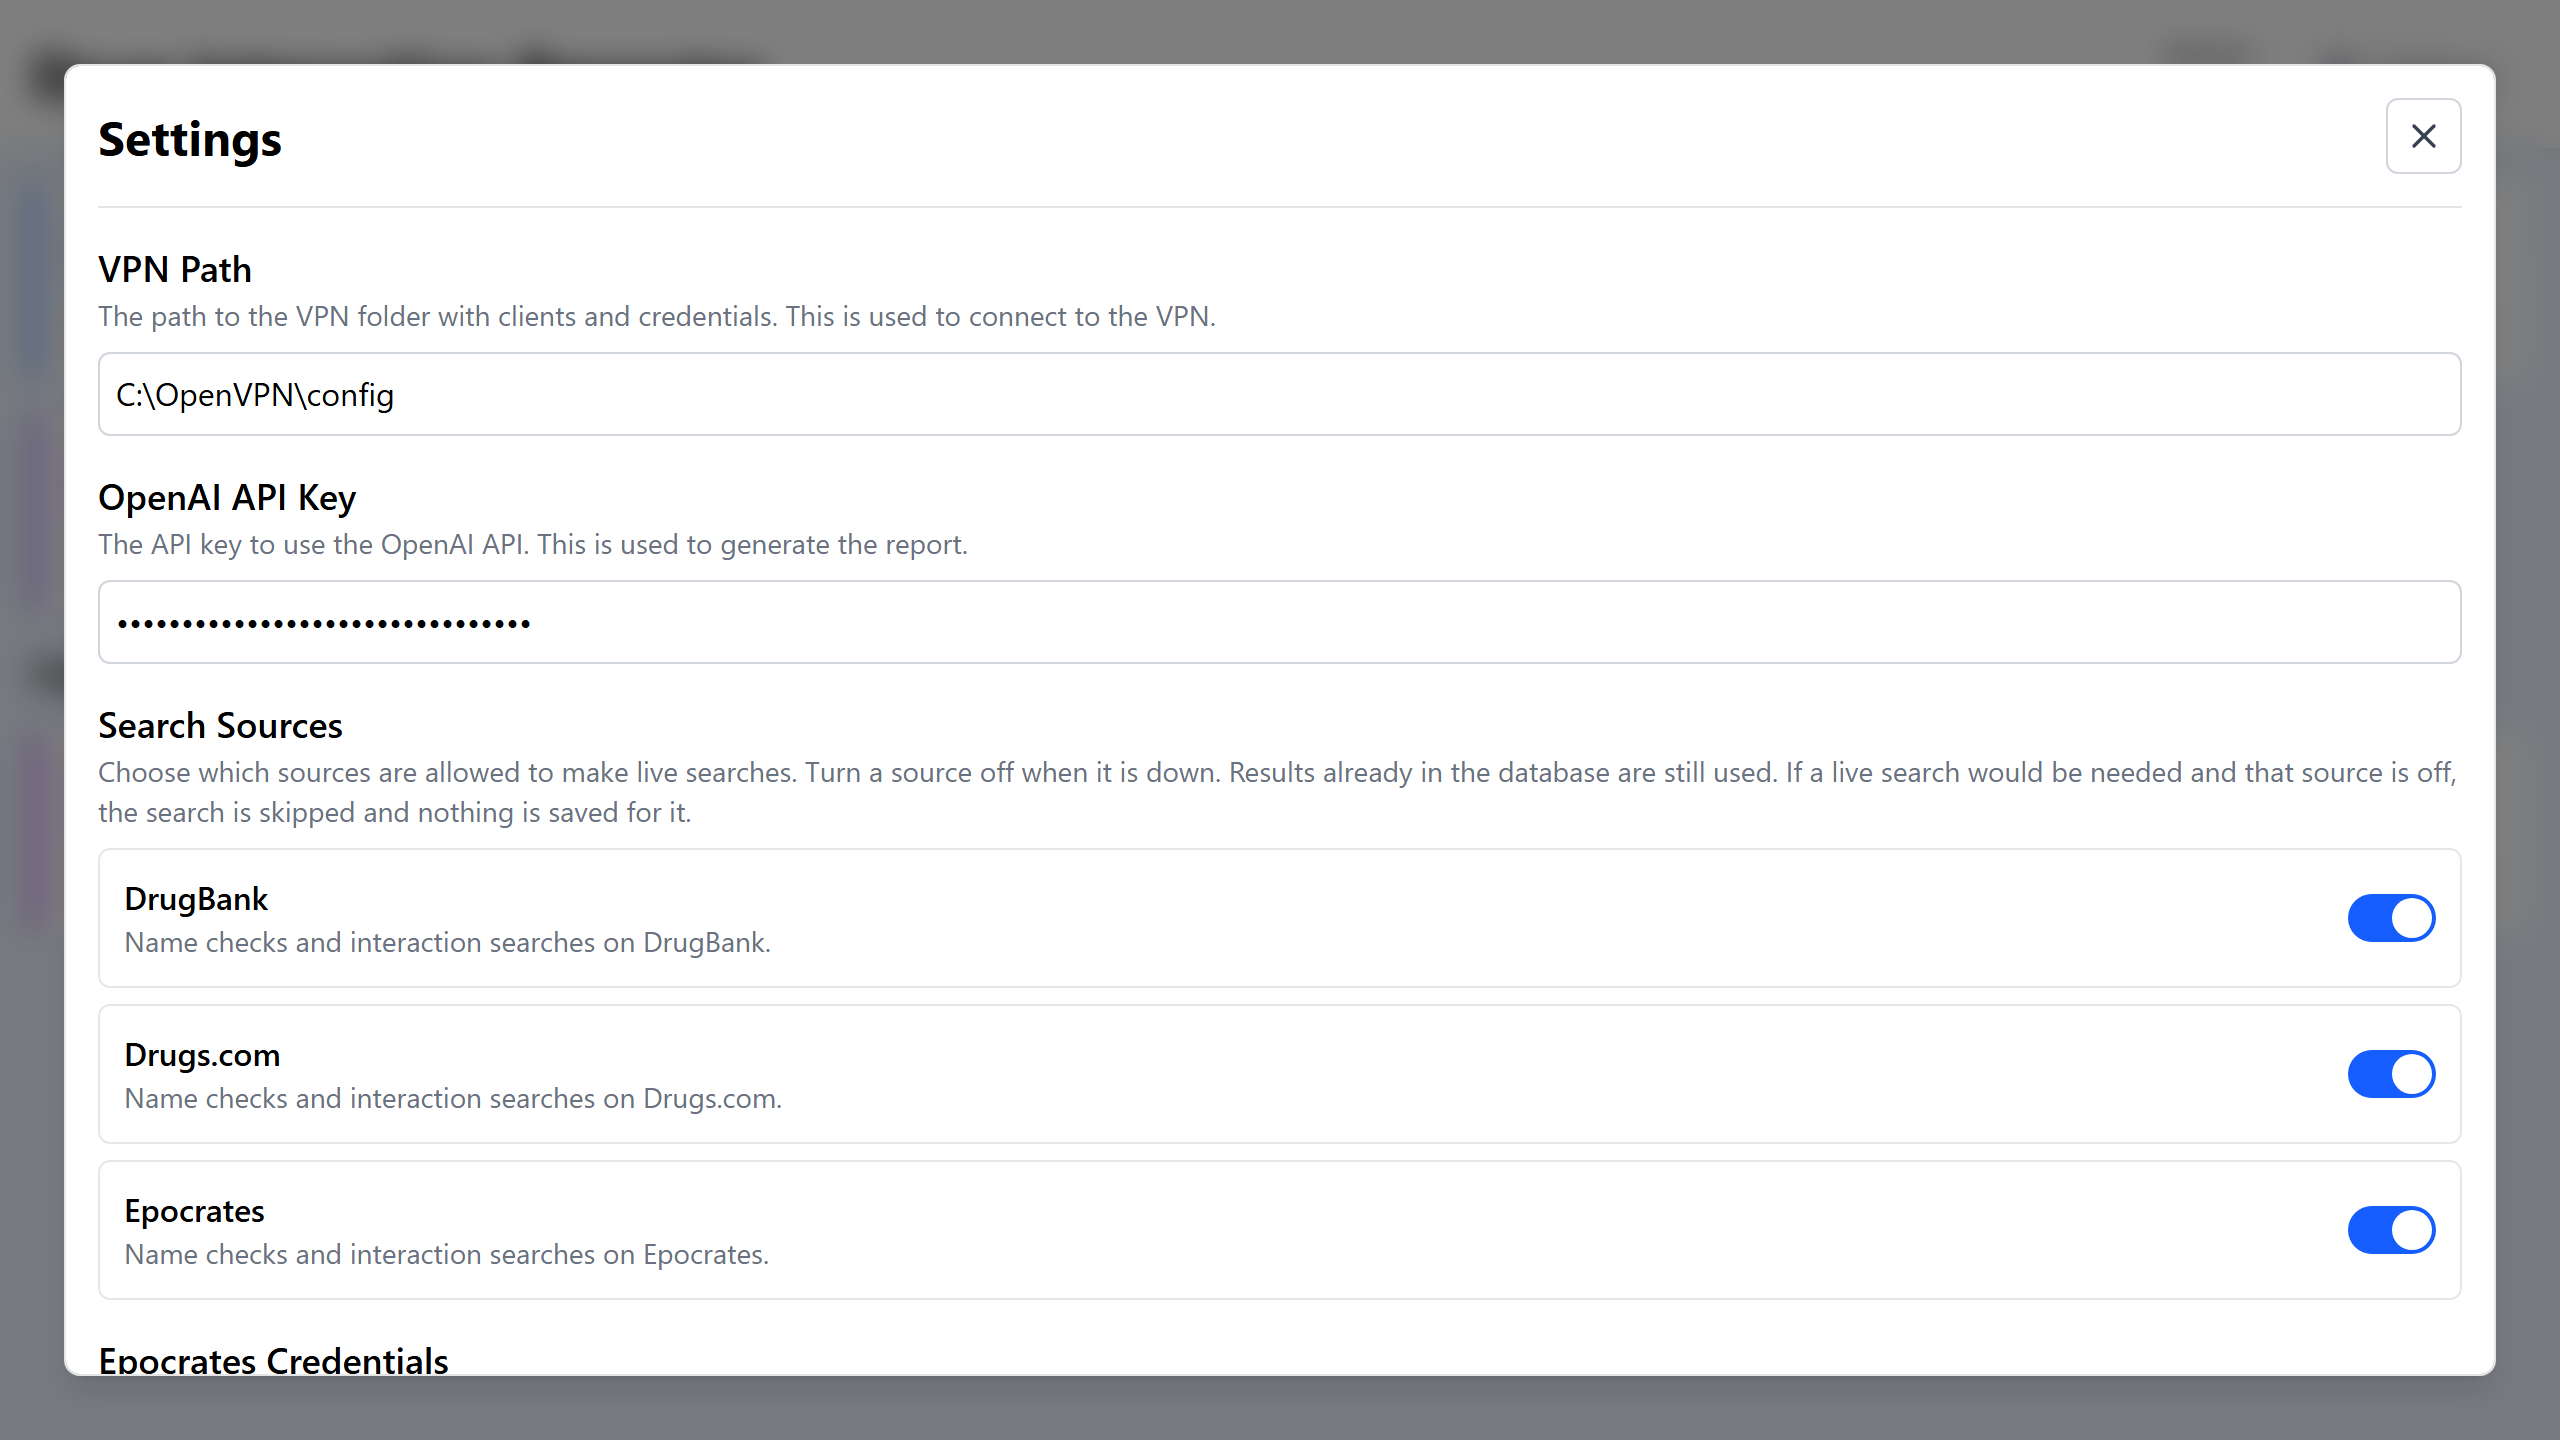
Settings cover the VPN folder, OpenAI API key, Epocrates credentials, and per-source switches. A source can be disabled when unavailable while results already stored for it remain usable.
Export the AI inputs
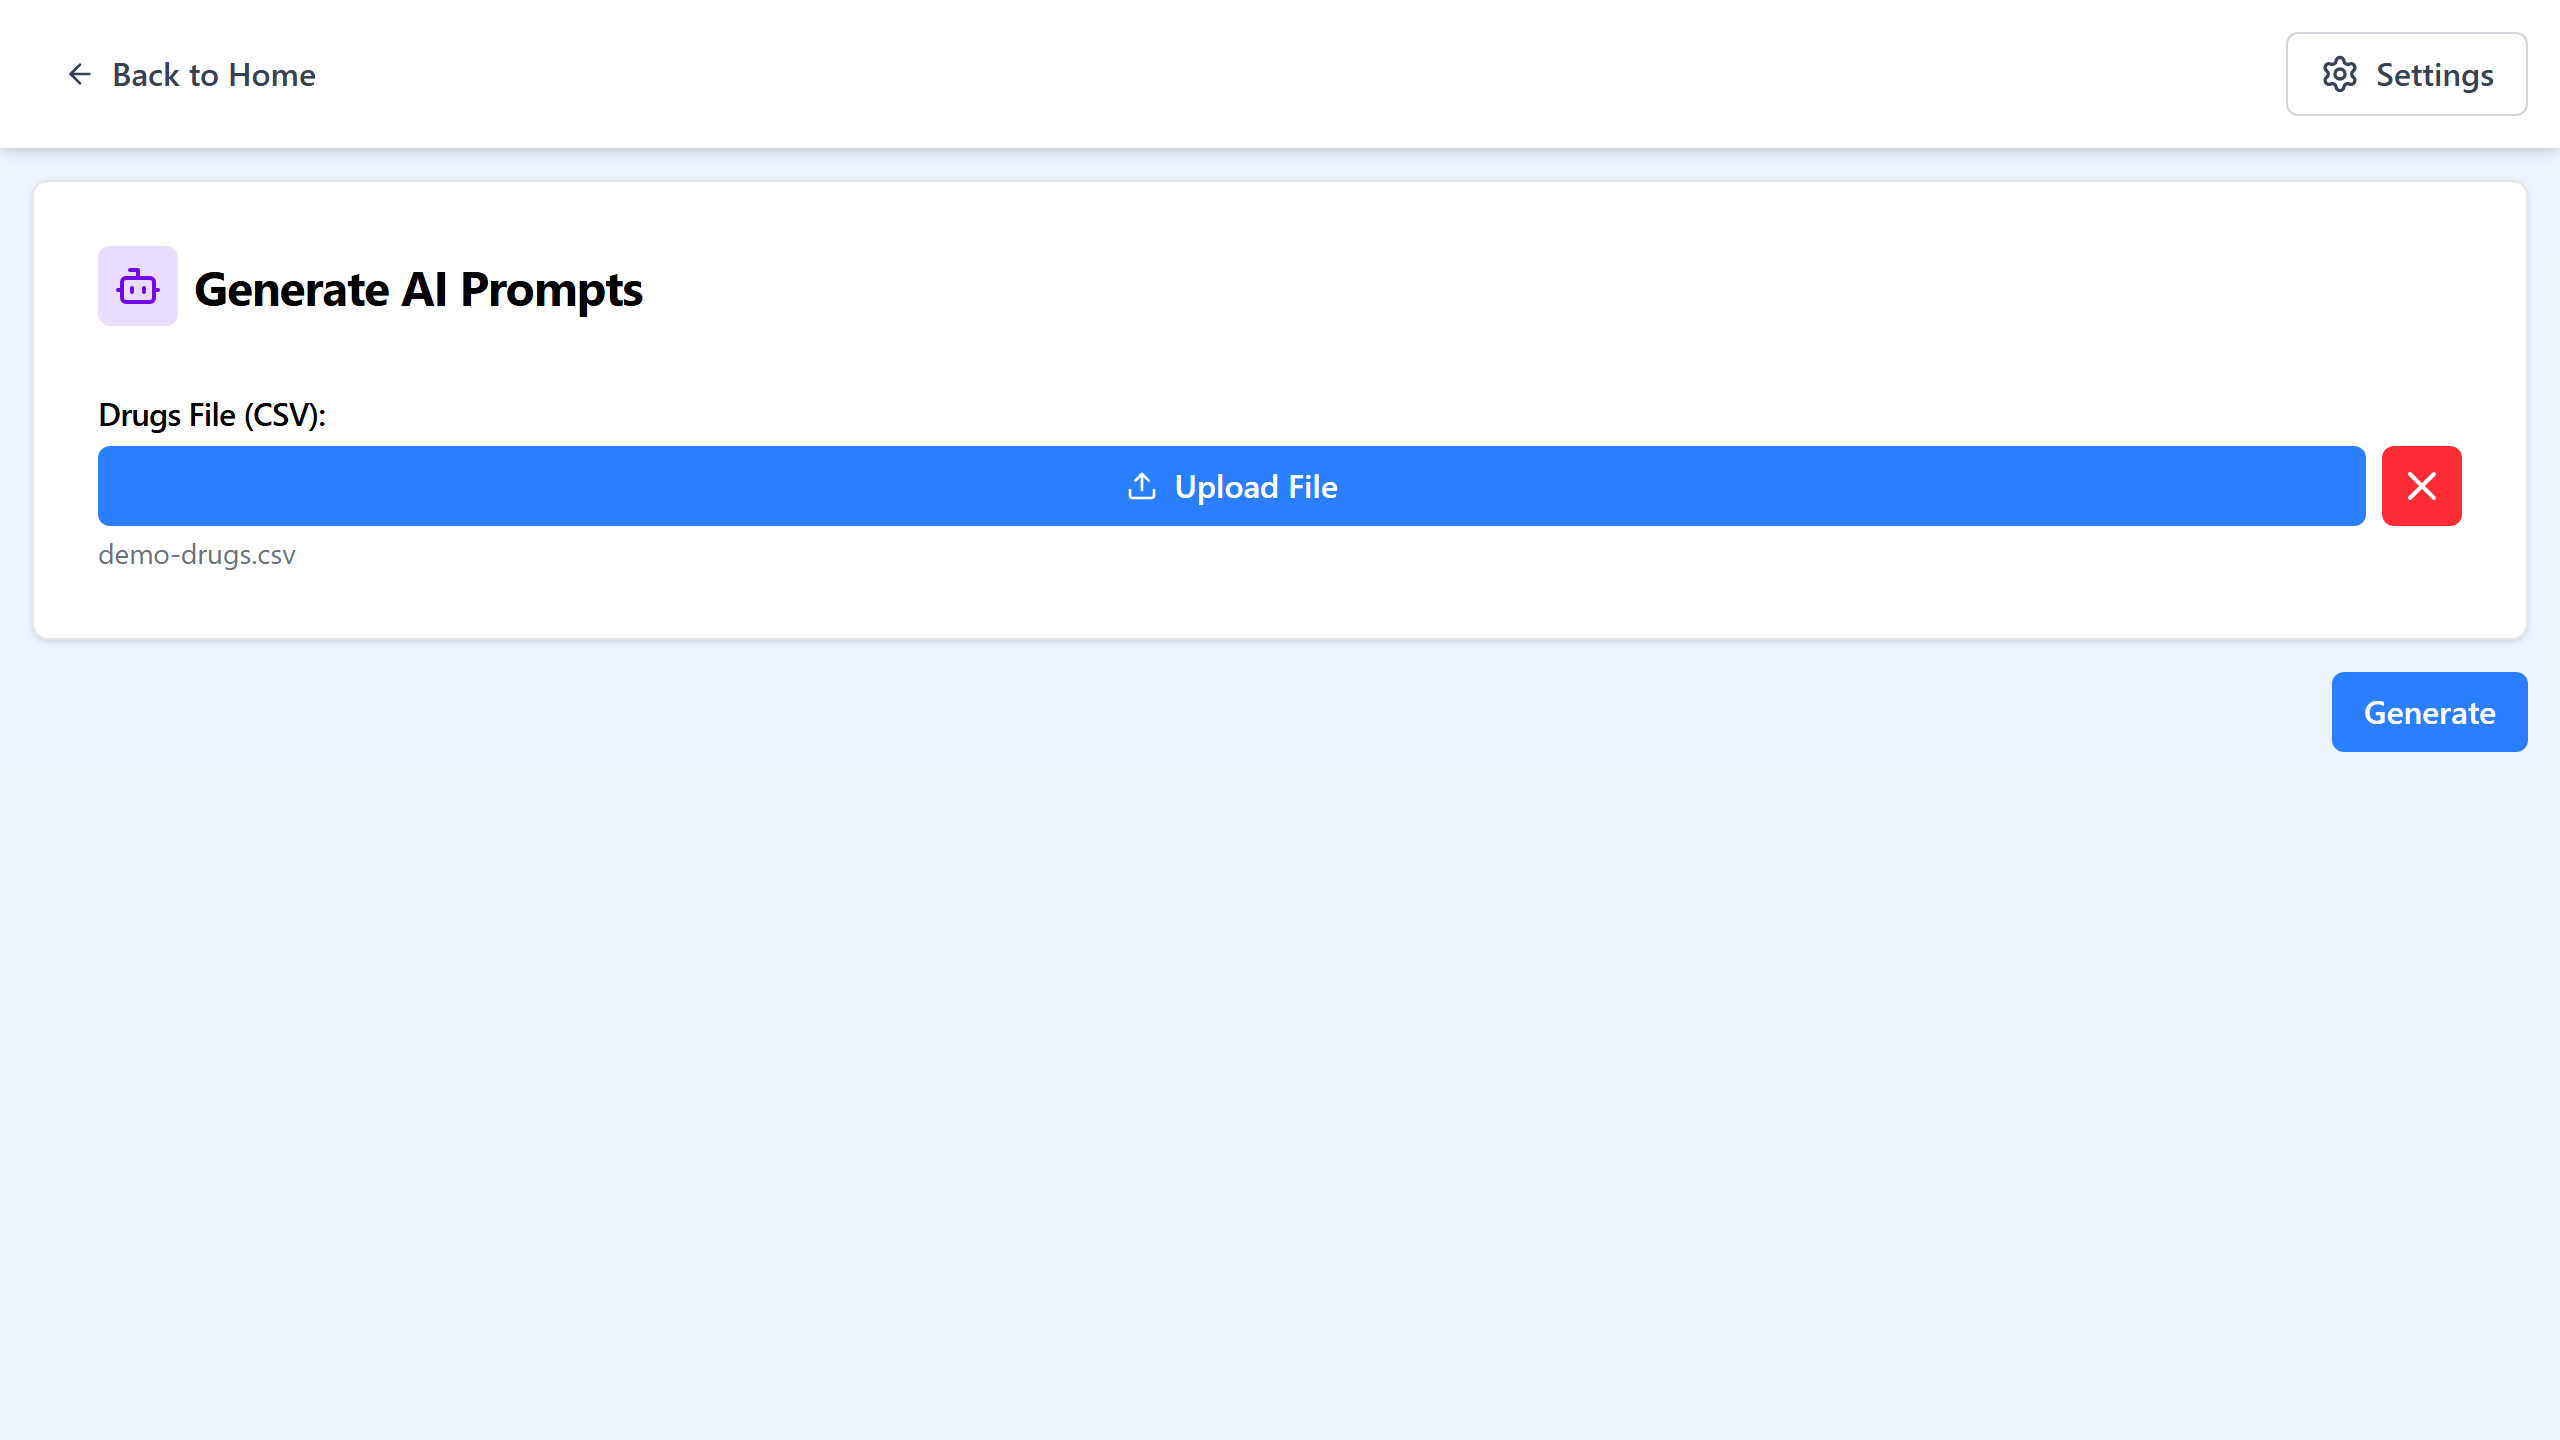
The prompt export workflow produces the exact structured model inputs for a drug list as JSON. I used this to build the fine-tuning dataset from the company’s completed reports and the symbols chosen by experts.
The symbol system
Each interacting pair gets a symbol on its slide. The model proposes a type, severity, and direction, together with literal supporting excerpts for human review.
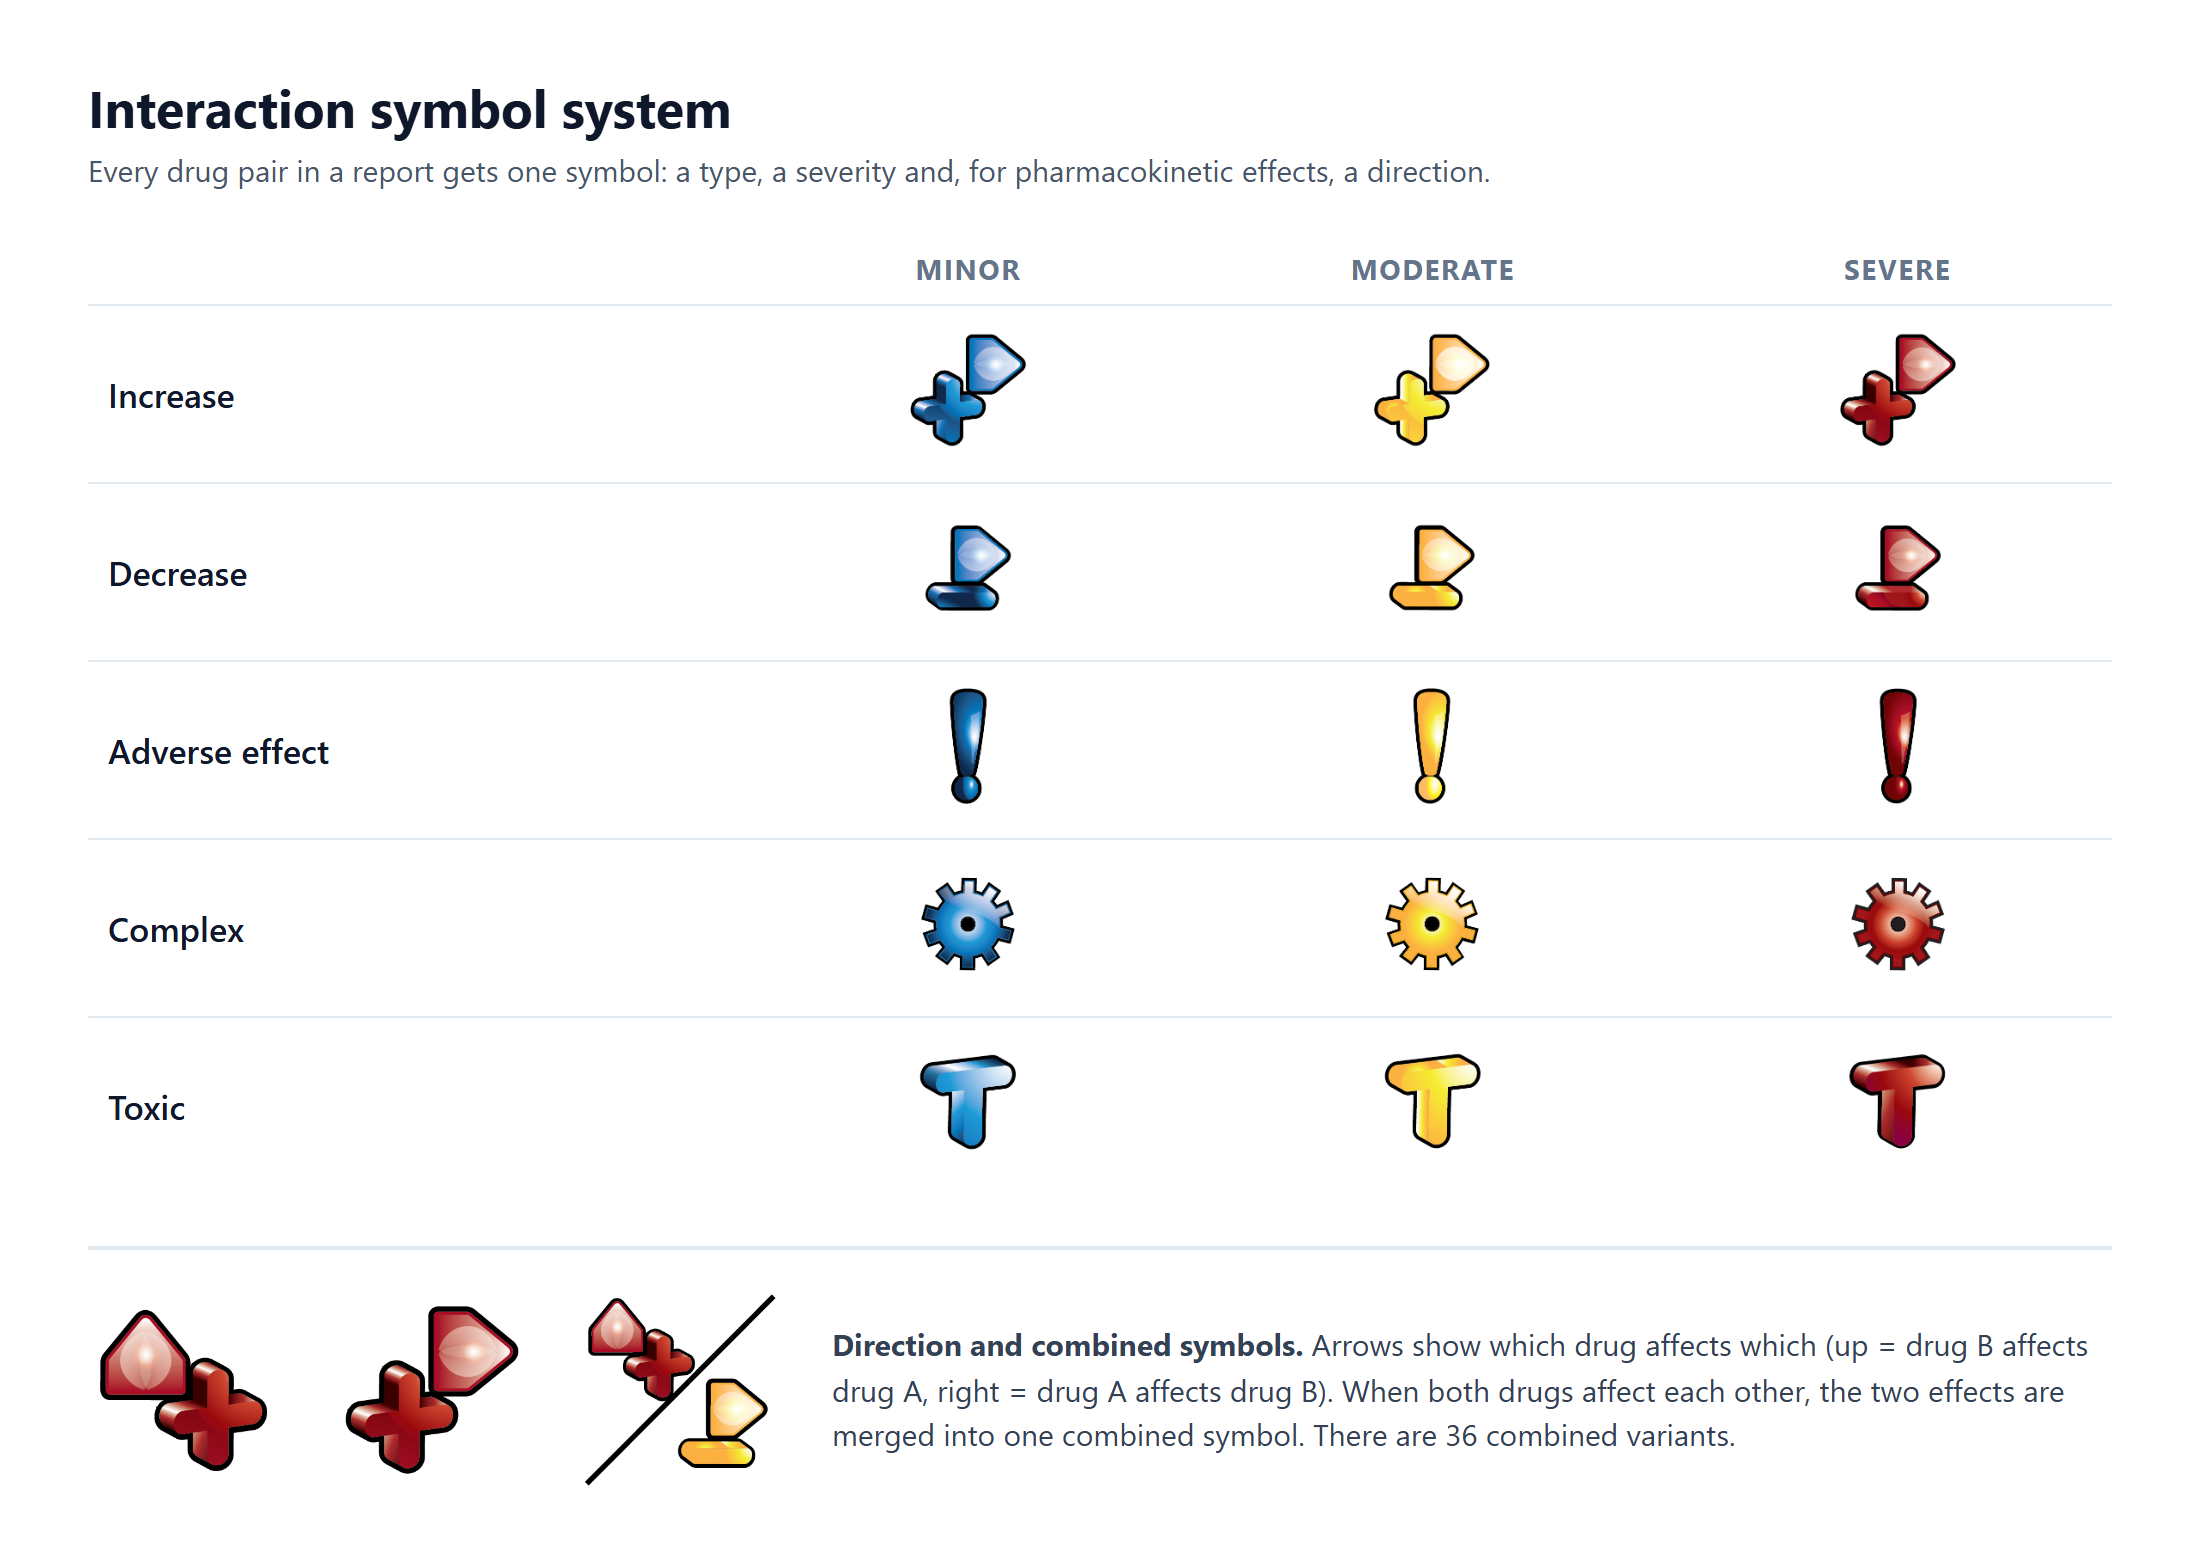
Five types
Increase, decrease, adverse effect, complex, and toxic.
Three severities
Minor is blue, moderate is yellow, and severe is red.
Direction
For increase and decrease, the symbol indicates which drug affects which.
Combined symbols
When both drugs affect each other, two effects can be merged into one icon, with 36 combined variants.
Key challenges
Store results instead of repeating thousands of requests
The largest gain came from the PostgreSQL layer. It stores validated names per source, raw pair interactions with a search timestamp, AI decisions, and imported human-reviewed results. A SQL view cross-joins drugs and gathers results across their aliases. Only missing or year-old source pairs need another request; partial reports touch k·(k−1)/2 + k·(n−k) pairs involving new drugs. The browser and VPN start only when live work is required, so a run served entirely from the database opens neither.
Adapt the searches to each source
Each website has its own strategy behind a common SourceService interface. Drugs.com autocomplete resolves IDs without loading pages. DrugBank concept-search requests, including a 307 redirect, lead to direct interaction API calls. Epocrates reuses one authenticated session. Similarity scoring resolves different name spellings. A shared Playwright browser with a stealth plugin runs behind OpenVPN, checks that the public IP changed, retries failed connections, and closes the browser and VPN when finished.
Fine-tune proposals that are easier to review
I built the training dataset from Built by Doctors’ completed reports, pairing each slide’s structured input with the symbol experts had chosen, then fine-tuned GPT-4.1-mini. The model must return strict JSON with type, severity, direction, and literal excerpts. Answers are validated before saving and invalid output is discarded. The evidence is highlighted on the slide, so reviewers can confirm or correct a proposal with the supporting text in front of them.
How it works
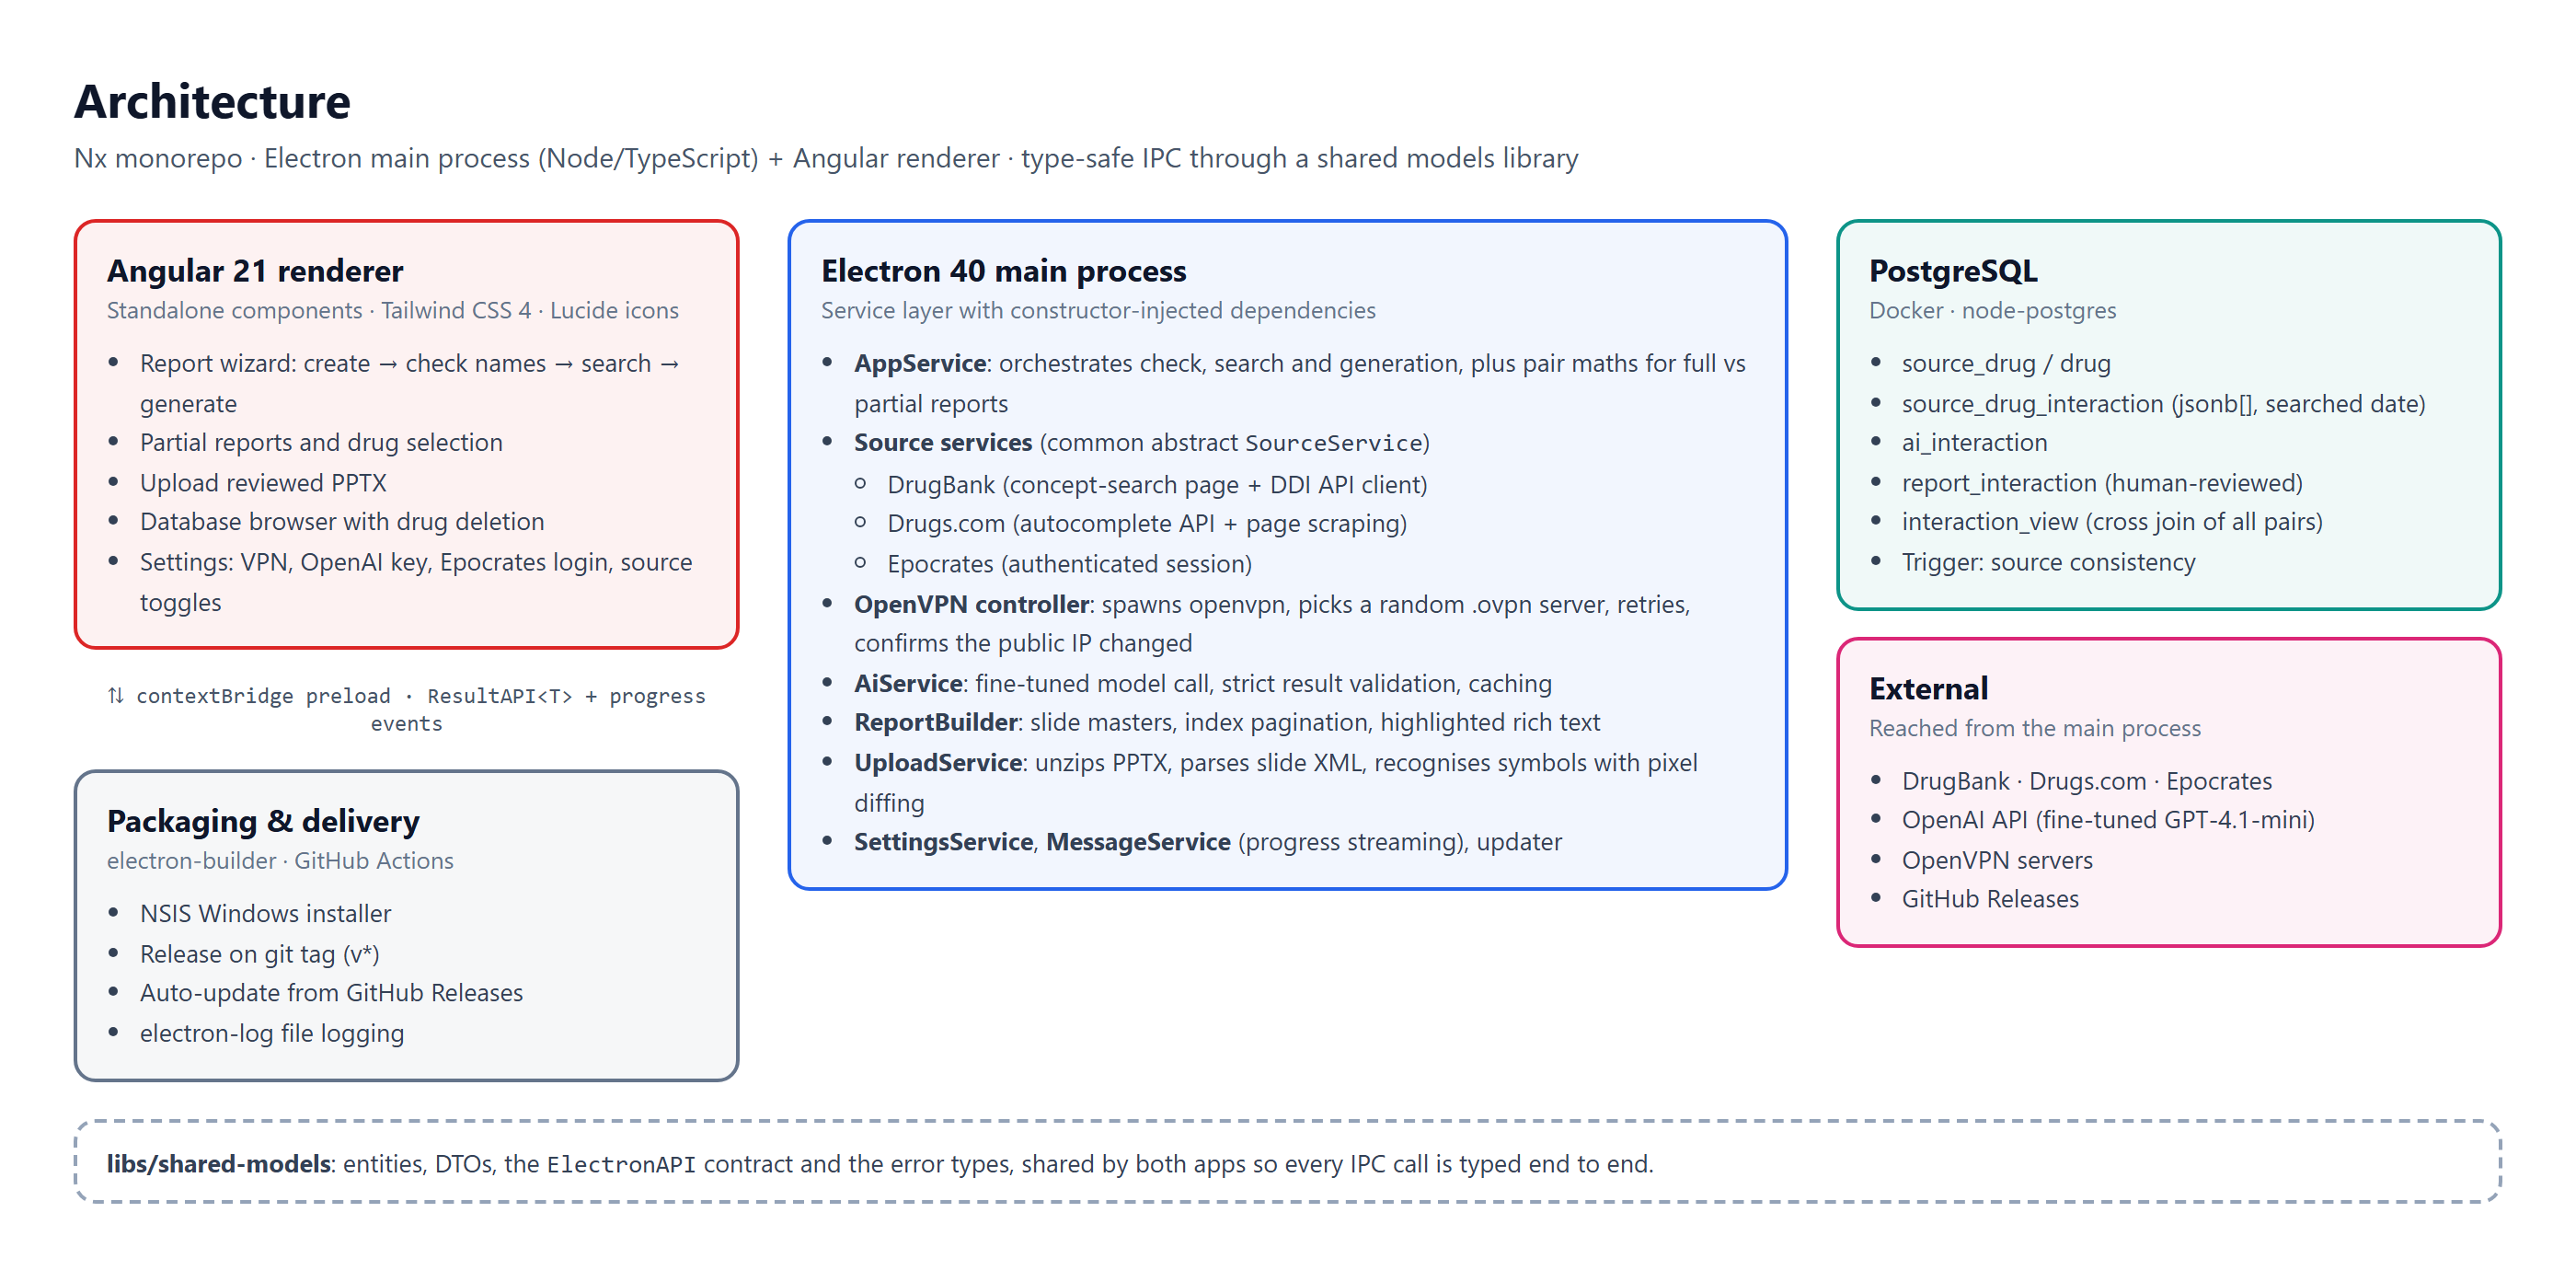
An Nx monorepo separates the Angular renderer from Electron’s Node.js main process. A shared models library defines entities, the ElectronAPI contract, and error types, keeping calls across the preload bridge typed at both ends.
Typed IPC and recovery states
Calls return a ResultAPI<T> union and progress streams back to the renderer. The UI maps error types to specific recovery screens, including missing VPN configuration and failed connections.
Build the presentation from scratch
PptxGenJS creates a tall 8.25 × 15.65 inch layout with branded slide masters, an index paginated at 30 entries per page, and page numbers filled in after generation. Duplicate descriptions across aliases are merged, and the three sources’ severity scales are colour-coded consistently.
Round-trip reviewed decks
JSZip and xml2js unpack the PPTX and parse slide and relationship XML. Text shapes are read by position, while sharp normalises symbol images and pixelmatch compares them against 57 known symbols. A match of at least 95% counts as found.
Packaging and releases
GitHub Actions builds on version tags and publishes a Windows NSIS installer through GitHub Releases. electron-updater installs updates in the background, and electron-log writes logs to disk. The app is in production use at Built by Doctors; version 1.2.1 was released in October 2026.
Results
A report that previously took about two weeks can now be produced in as little as two days. Most of the remaining time is human review, supported by the model’s highlighted evidence. The application replaced a legacy tool that created blank report pages with a complete workflow from a drug list to a finished deck.
- About 80 drugs per typical report: 3,160 pairs and roughly 9,500 source lookups, now automated and mostly served from stored results.
- A model trained on the company’s own reports proposes symbols with evidence, while reviewers retain the ability to correct decisions.
- Reviewed decisions feed back into PostgreSQL so later reports reuse the work.